Hello everyone, it’s a beautiful Sunday, and a perfect time to analyse what may go down this week.
so let’s dive right in and start with the NZD/USD
1. NZD/USD

On the daily chart, all we can see is a descending channel which has driven price to 0.67174.
The price has been ranging between 0.68528 and 0.67325 in a minor ascending channel. If you zoom out to the weekly channel, you will find out that the current price is resting on a key support level supported by BOTH TIME FRAMES (weekly and daily)
In my opinion, I sense that the daily support is getting WEAKER. In order to verify this statement, we would be needing a further confirmation, which should be ready after Monday’s or Tuesday’s candlestick’s close (10 pm GMT) .
2. EUR/USD
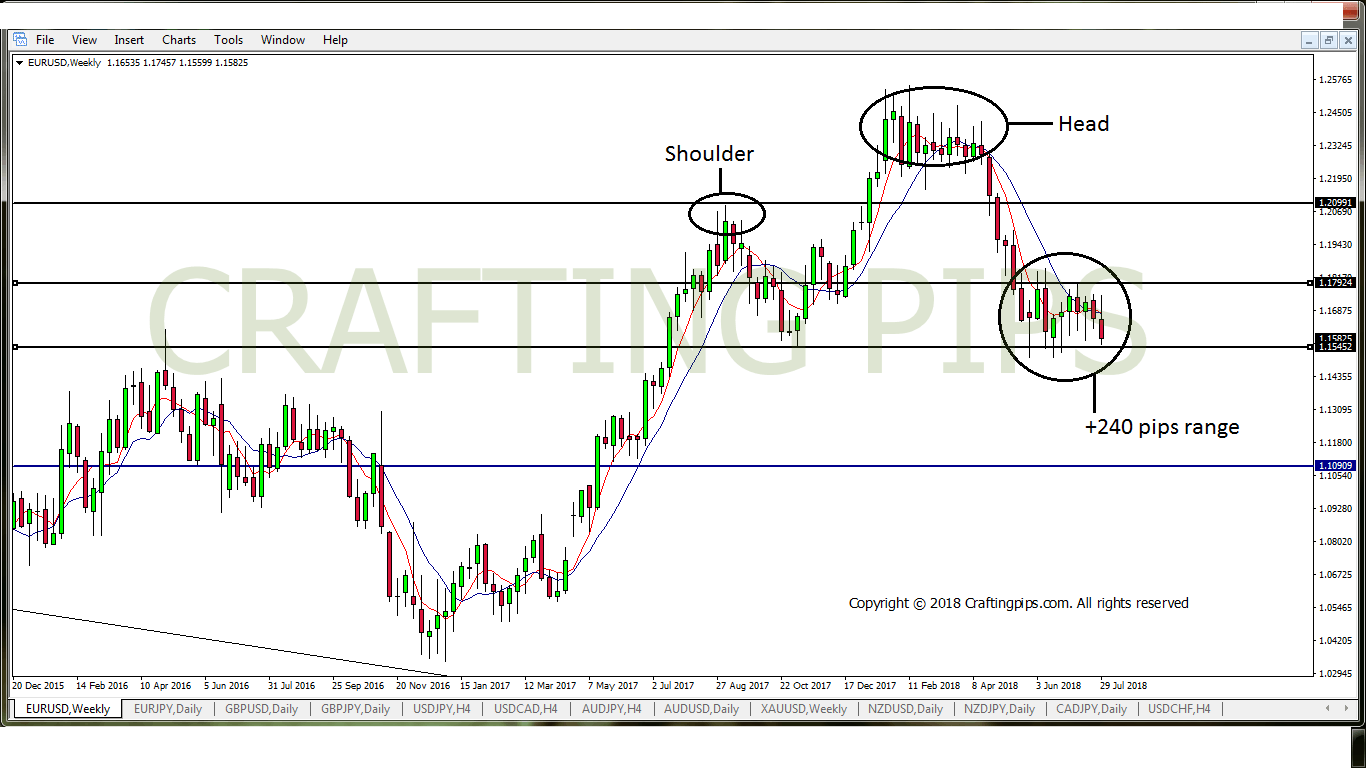
On the weekly chart, EUR/USD presents us with a classic head and shoulder’s pattern, only that in this case the shoulder’s are not even. The last shoulder has been locked within a 240 pips range.
A buy or a sell will be more obvious by Tuesday after confirmation.
3. GBP/JPY

I had to zoom out of GBP/JPY daily chart to capture the whole scenario.
GBP/JPY is in a massive descending channel, and within that channel there are minor bullish and bearish retracements which is typical.
From the chart above, The third support level of the minor ascending channel may be the BREAKOUT that would send GBP/JPY below level 144.497 on a bearish run.
4. NZD/JPY


NZD/JPY closed on Friday having a bearish move, though still inside a key support area within a channel.
If you zoom back to the daily chart, you will observe that this 4 hours channel is within a highly bearish daily chart. In my opinion, NZD/JPY should be breaking the 75.024 level for a highly bearish run.
Before taking any of these trades, endeavor to wait for confirmations.
![]()
![]()
![]()
![]()
![]()
![]()