Hello traders,
let’s hit them charts
1. USD/CAD
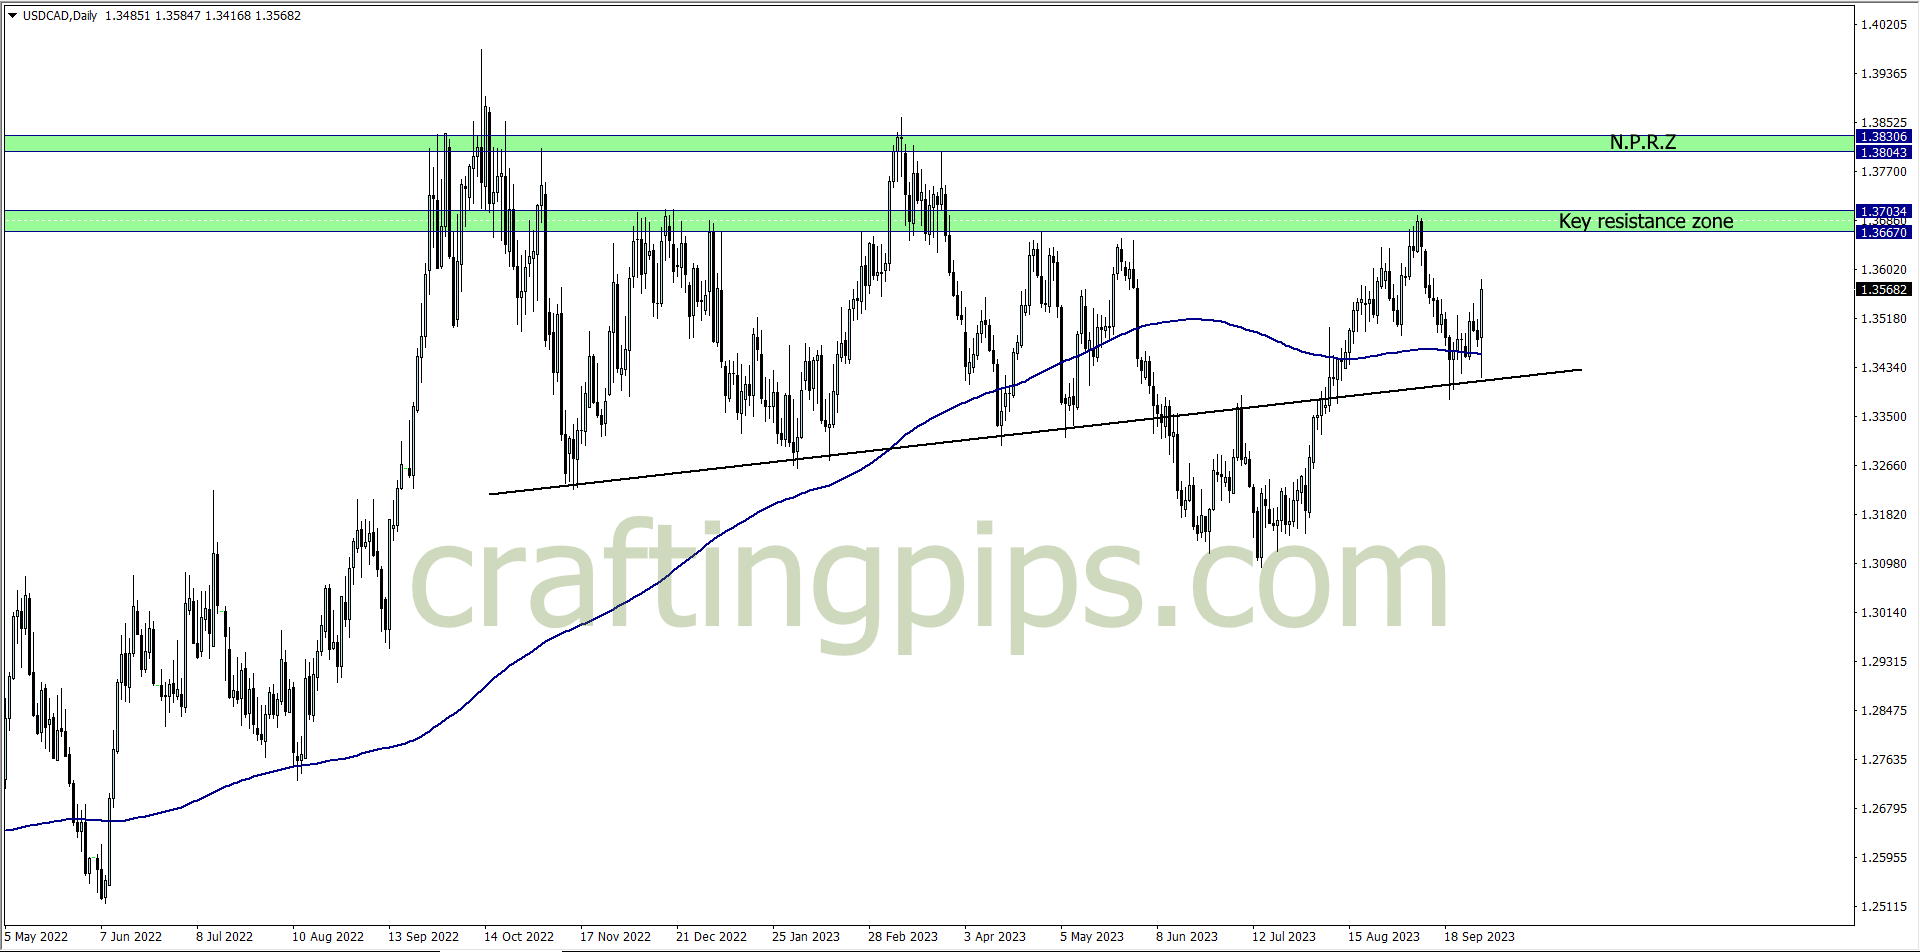
On Friday we saw the charged bulls on USDCAD killing every bear on their path.
This week I will be eyeing the key resistance zone, and how the bulls react to it. If we do get a breakout on the daily time fame, then I will most likely join the buyers to the NPRZ
However, if a reversal occurs, then support level 1.35280 will be a level to watch out for
2. USD/JPY
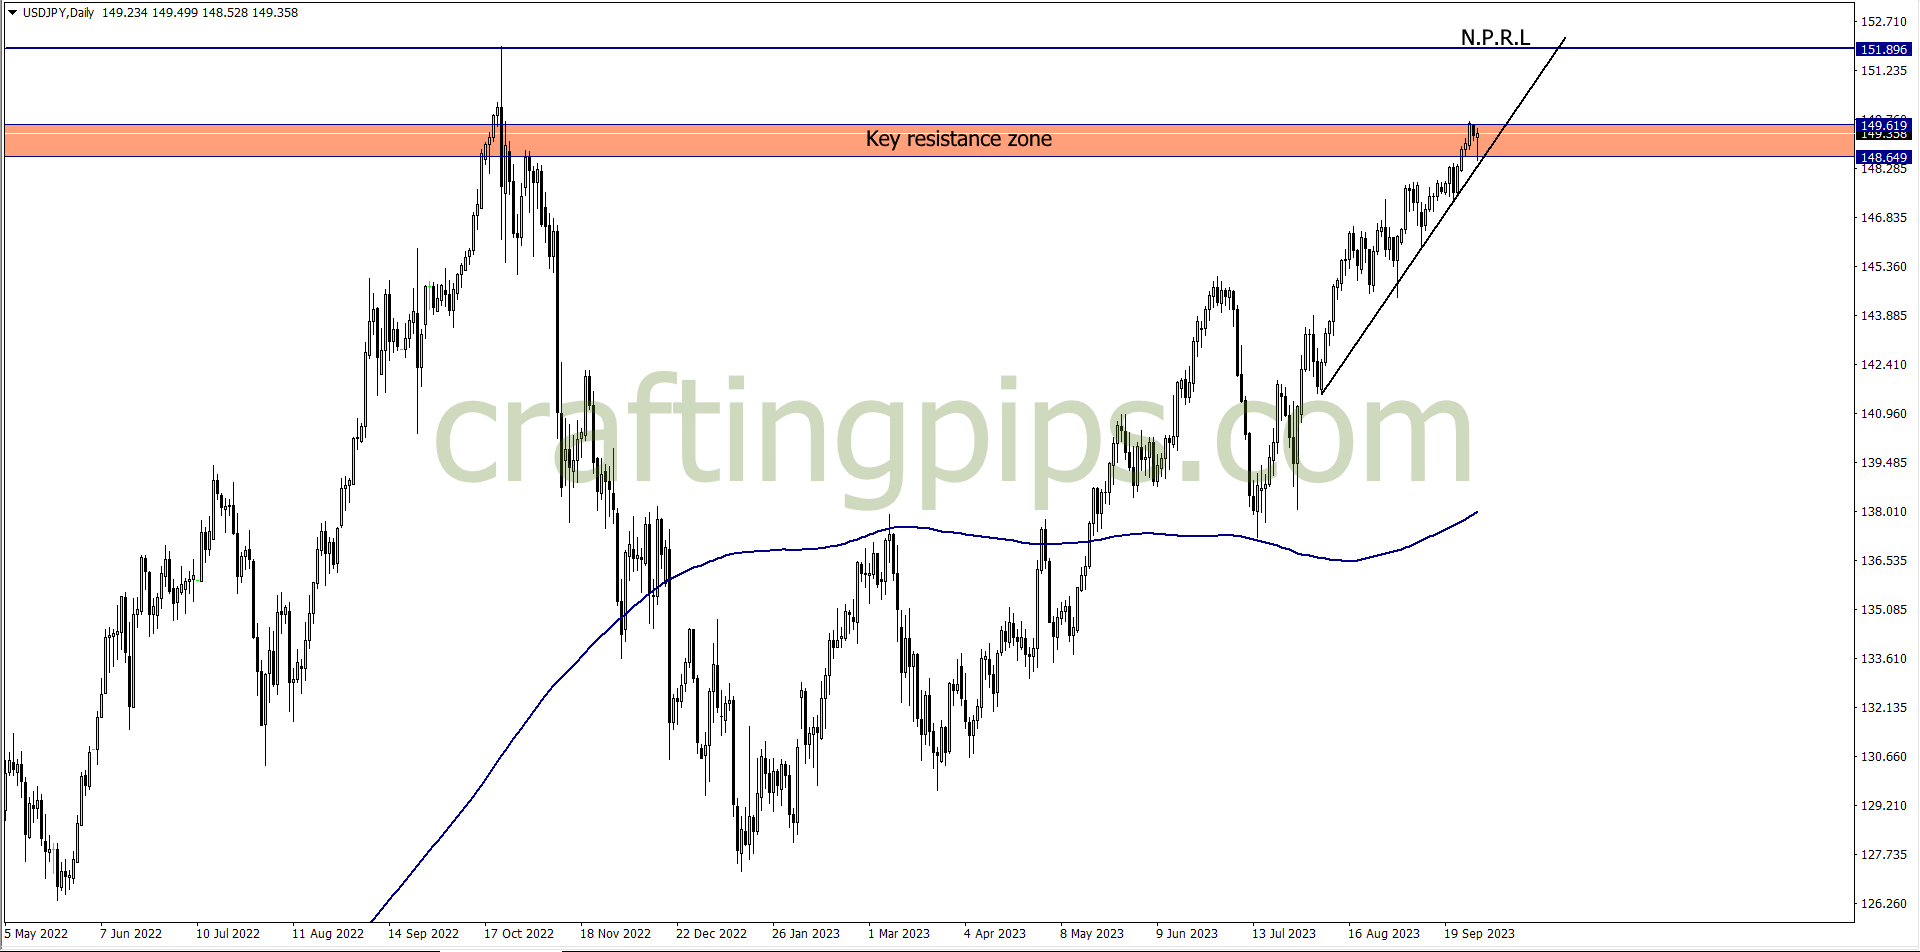
Since August 2023, the USD/JPY has been creating new highs.
On Friday, price formed a bullish pinbar, which may encourage buyers to break last week’s high (149.603). This week all I will be interested in, is seeing how price reacts to 149.603.
A breakout means I will be joining the buyers to NPRL
What say you?
NOTE:
Check out our mouth watering discounts on any of the proprietary firm’s challenges:
-
THE FUNDED TRADER: (Use the coupon code: THE0CRAFTER)
- BESPOKE FUNDING PROGRAMME
- FUNDED ENGINEER
- BLUE GUARDIAN (Use the coupon code: CRAFTER)
- GOAT FUNDED
- LARK FUNDING
- SKILLED FUNDED TRADER
- MAVEN TRADING
- MY FLASH FUNDING (Use the coupon code: “FILLIPO” for a -25% discount)
- THE5ERS