Hello traders,
Some pretty interesting setups are lined up for the week:
1. GBP/USD
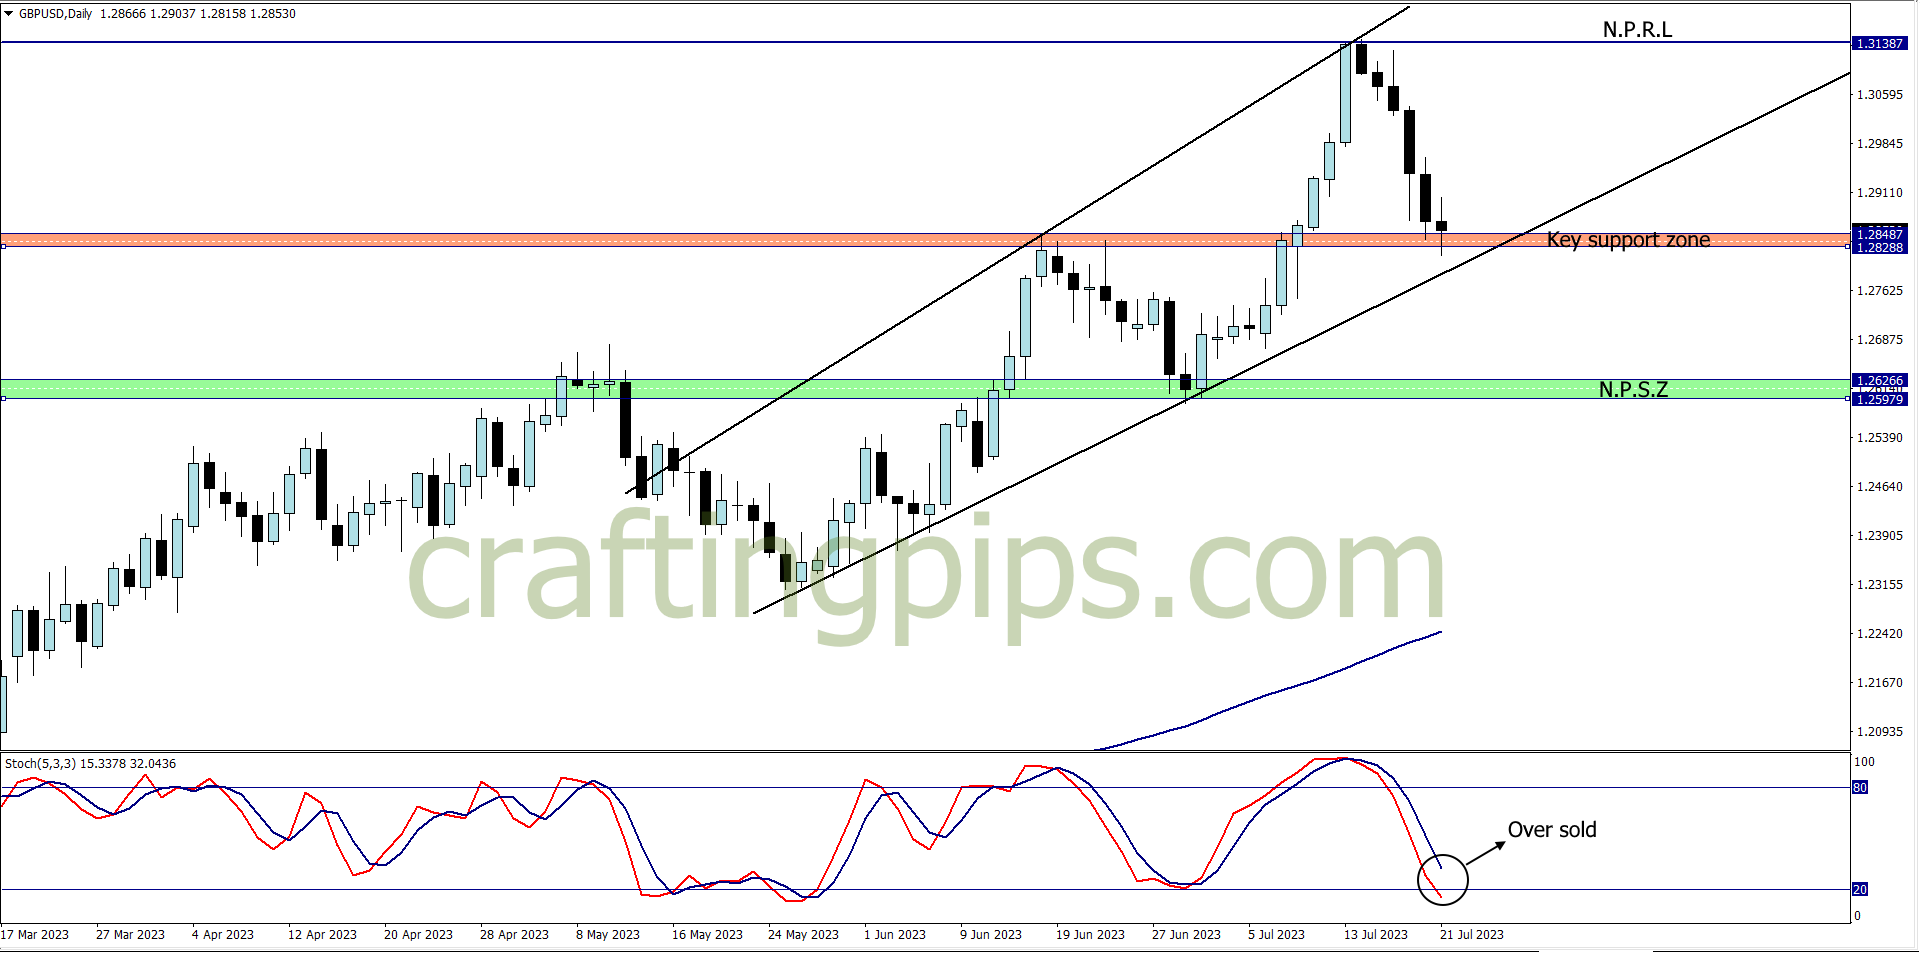
An ascending expanding channel spotted on the daily time frame of the GBP/USD.
The weekly chart also shows us that price is sitting on top of the 200 ma after last week’s pullback.
The oversold stochastic is already giving us a divergence to look forward to this week, which is an additional confirmation that sellers are getting exhausted, and this week will most likely
2. USD/JPY
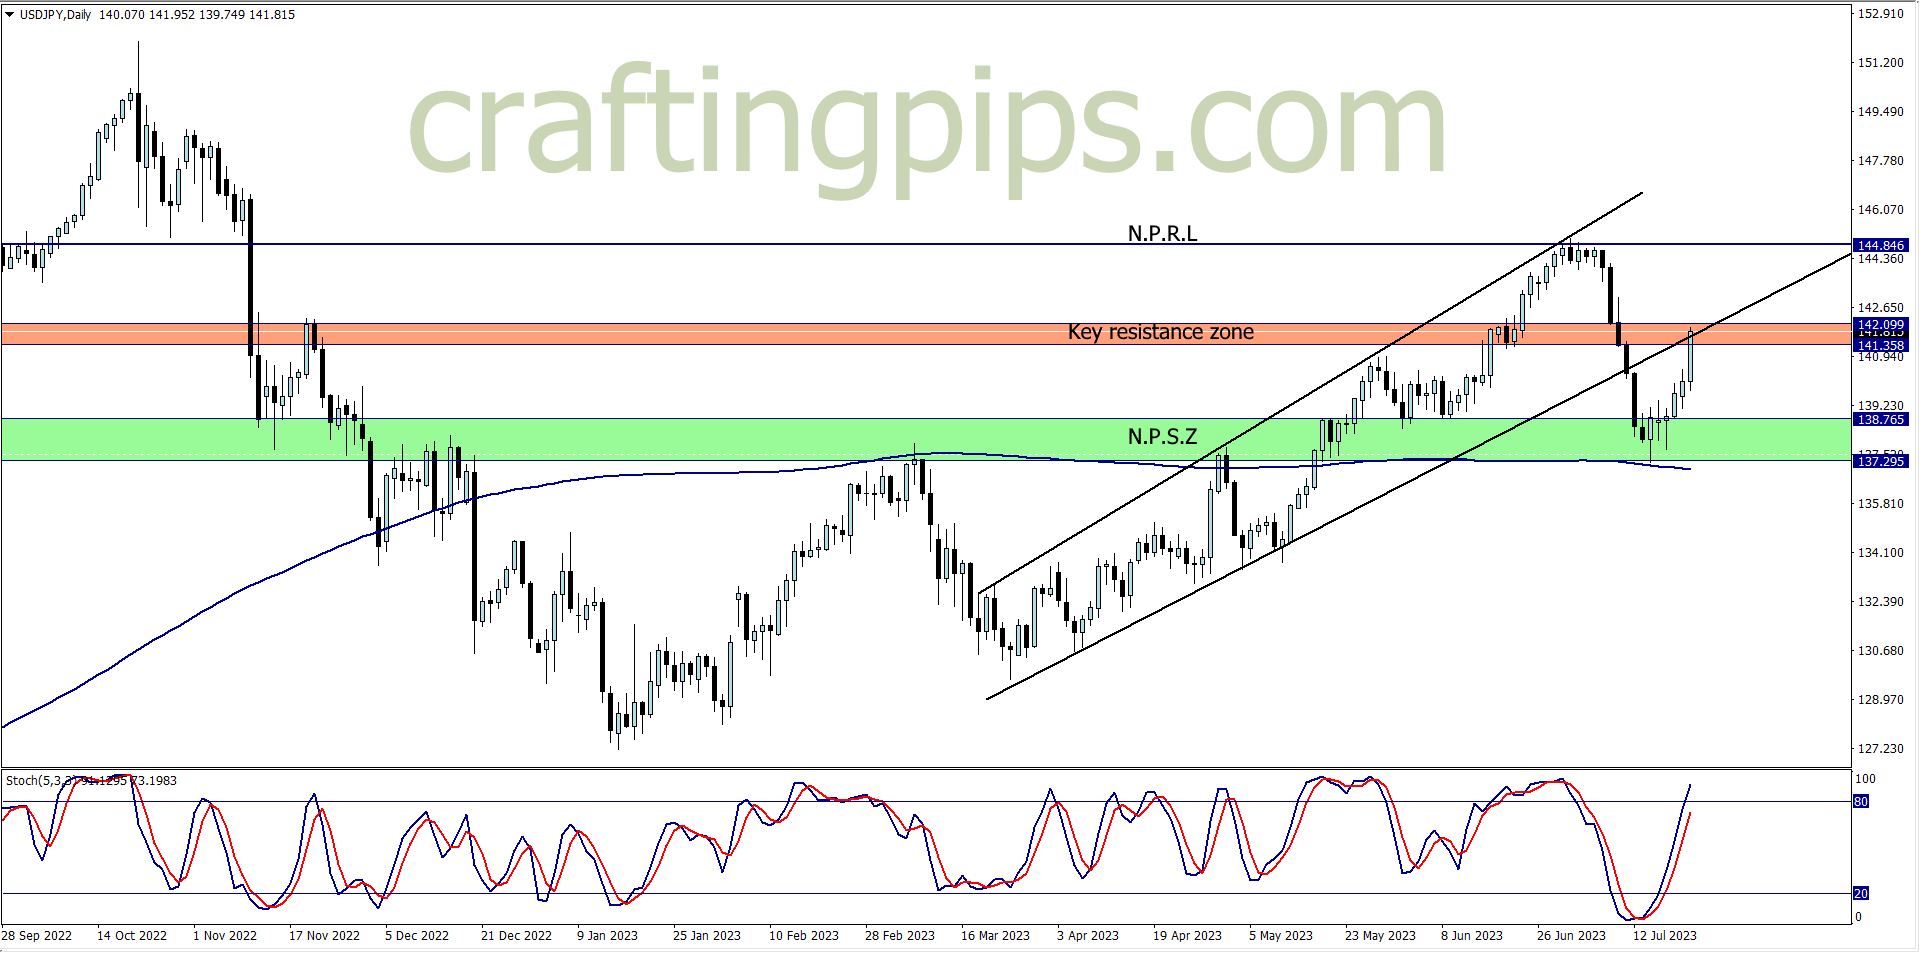
Last week’s support zone and 200 moving average was too strong for the bears to break, so buyers took charge.
This week we can already see that price is at the overbought region (judging from the stochastics), also the key resistance zone painted Salmon red is the last beacon of hope for the sellers who are looking forward to push price back down to the previous support zone.
This week I will be chilling to see how the daily candlestick closes on the USD/JPY. A breakout above the key resistance zone means the bulls may most likely push another 250 pips to the next resistance level, and a rejection may encourage sellers to move price over 200 pips, back to the previous support zone
3. EUR/JPY
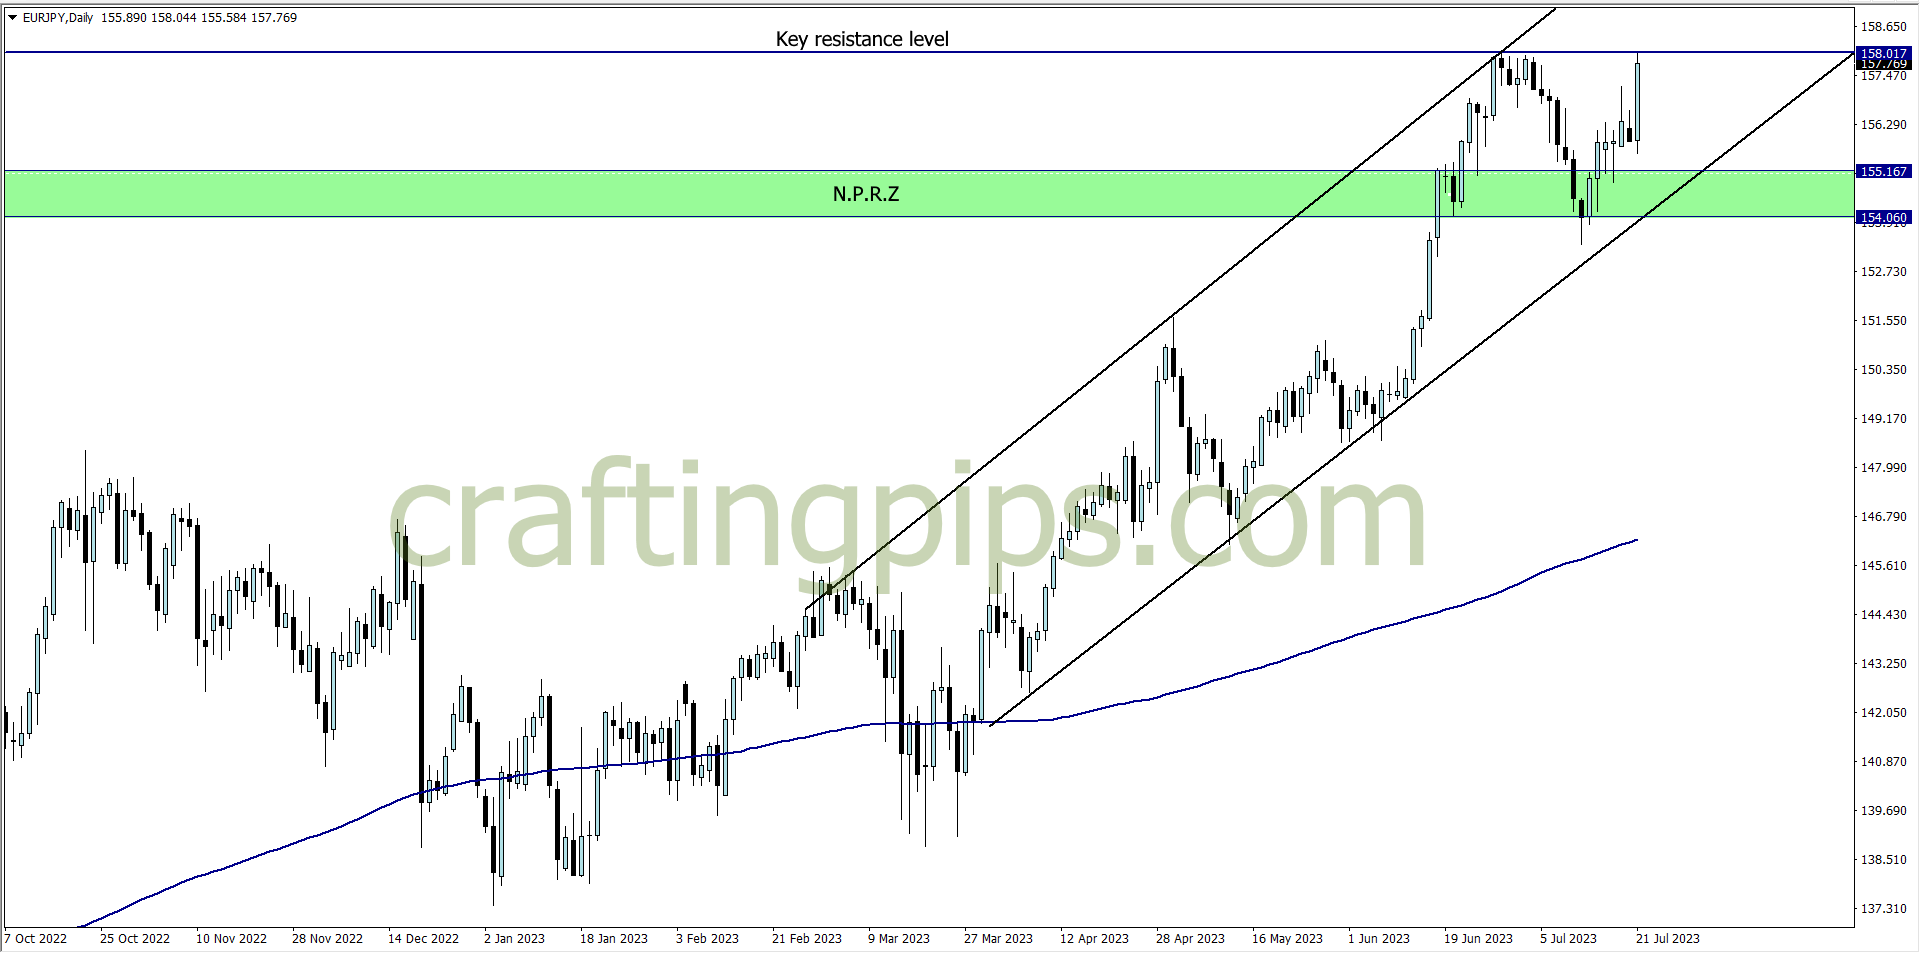
Double tops spotted on EUR/JPY
Waiting for the close of Monday’s daily candlestick is key here. A close above the resistance level could fetch us 50 to 120 pips . A close below the resistance level could encourage sellers to take price back to a minor support level (156.705)
This is another setup I may trade at the close of Monday’s daily candlestick
4. CAD/JPY
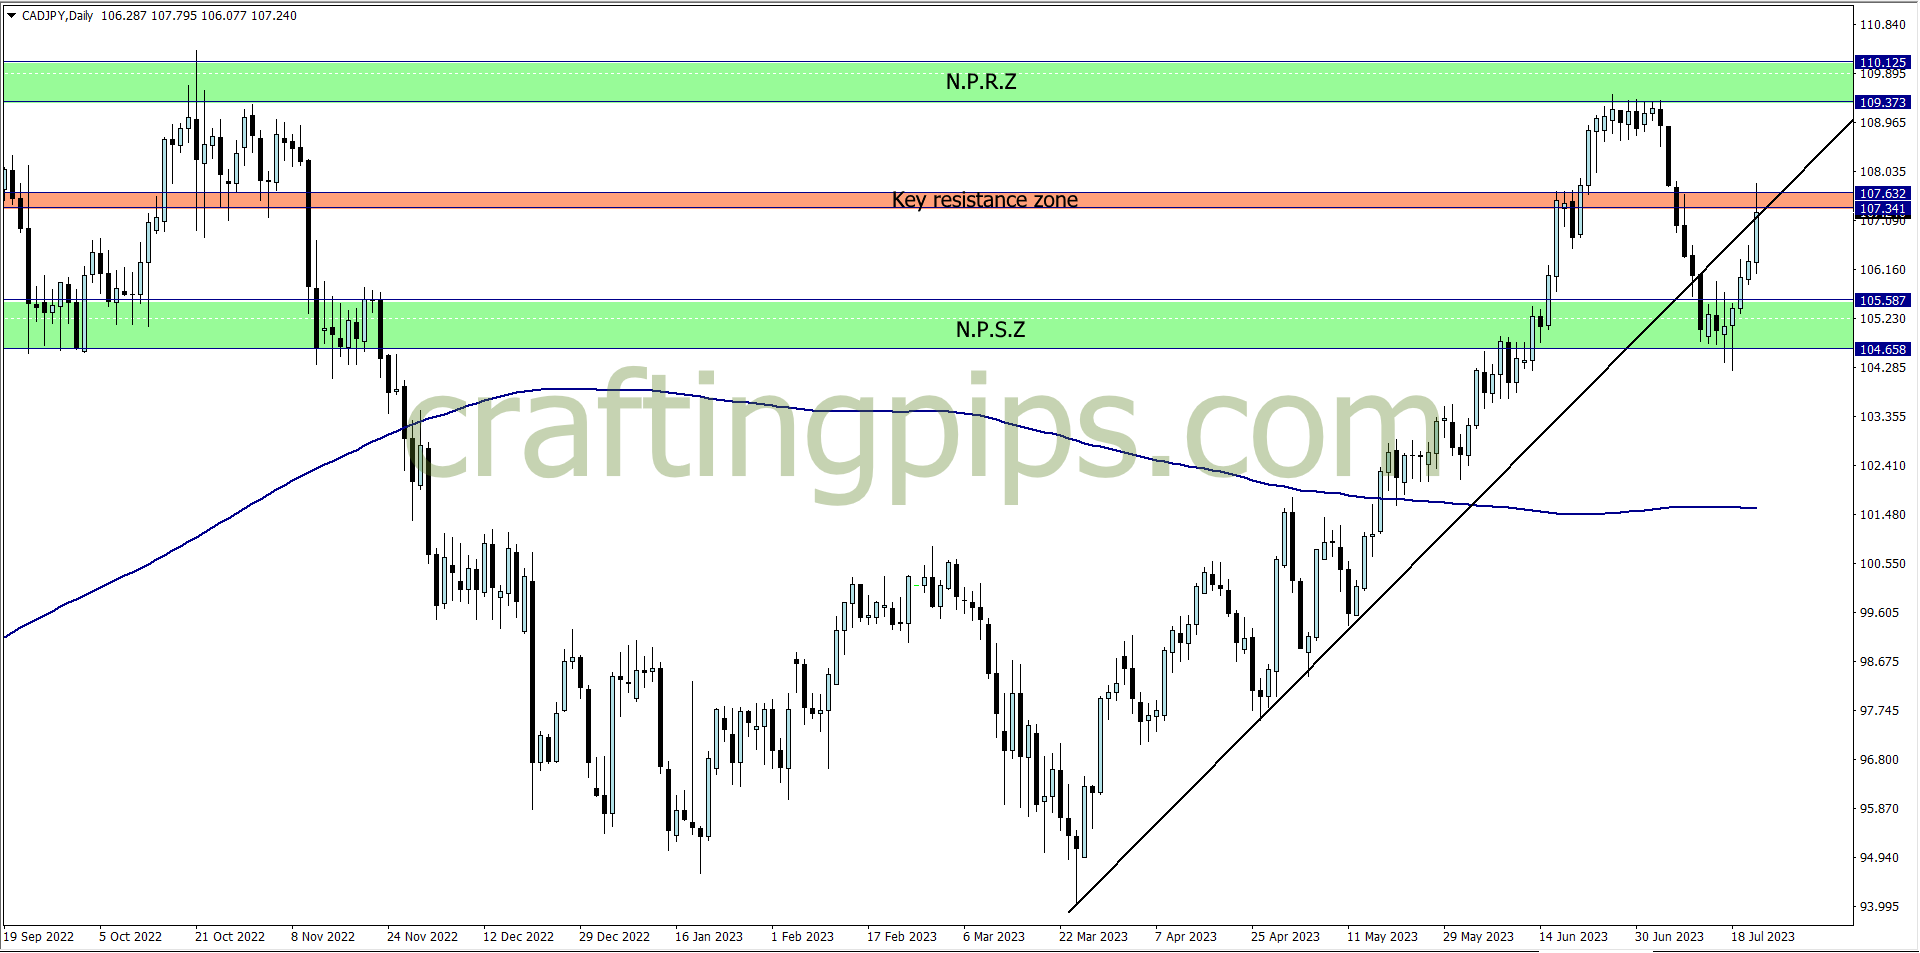
Last week CAD/JPY closed at a key resistance zone.
All we should be watching out for this week is: A reversal or breakout.
A reversal will most likely take price back to NPSZ, and a breakout will encourage buyers to take price to the NPRZ. While waiting for any of those two events to occur, do have additional confirmation tools to ascertain entries.
5. CHF/JPY
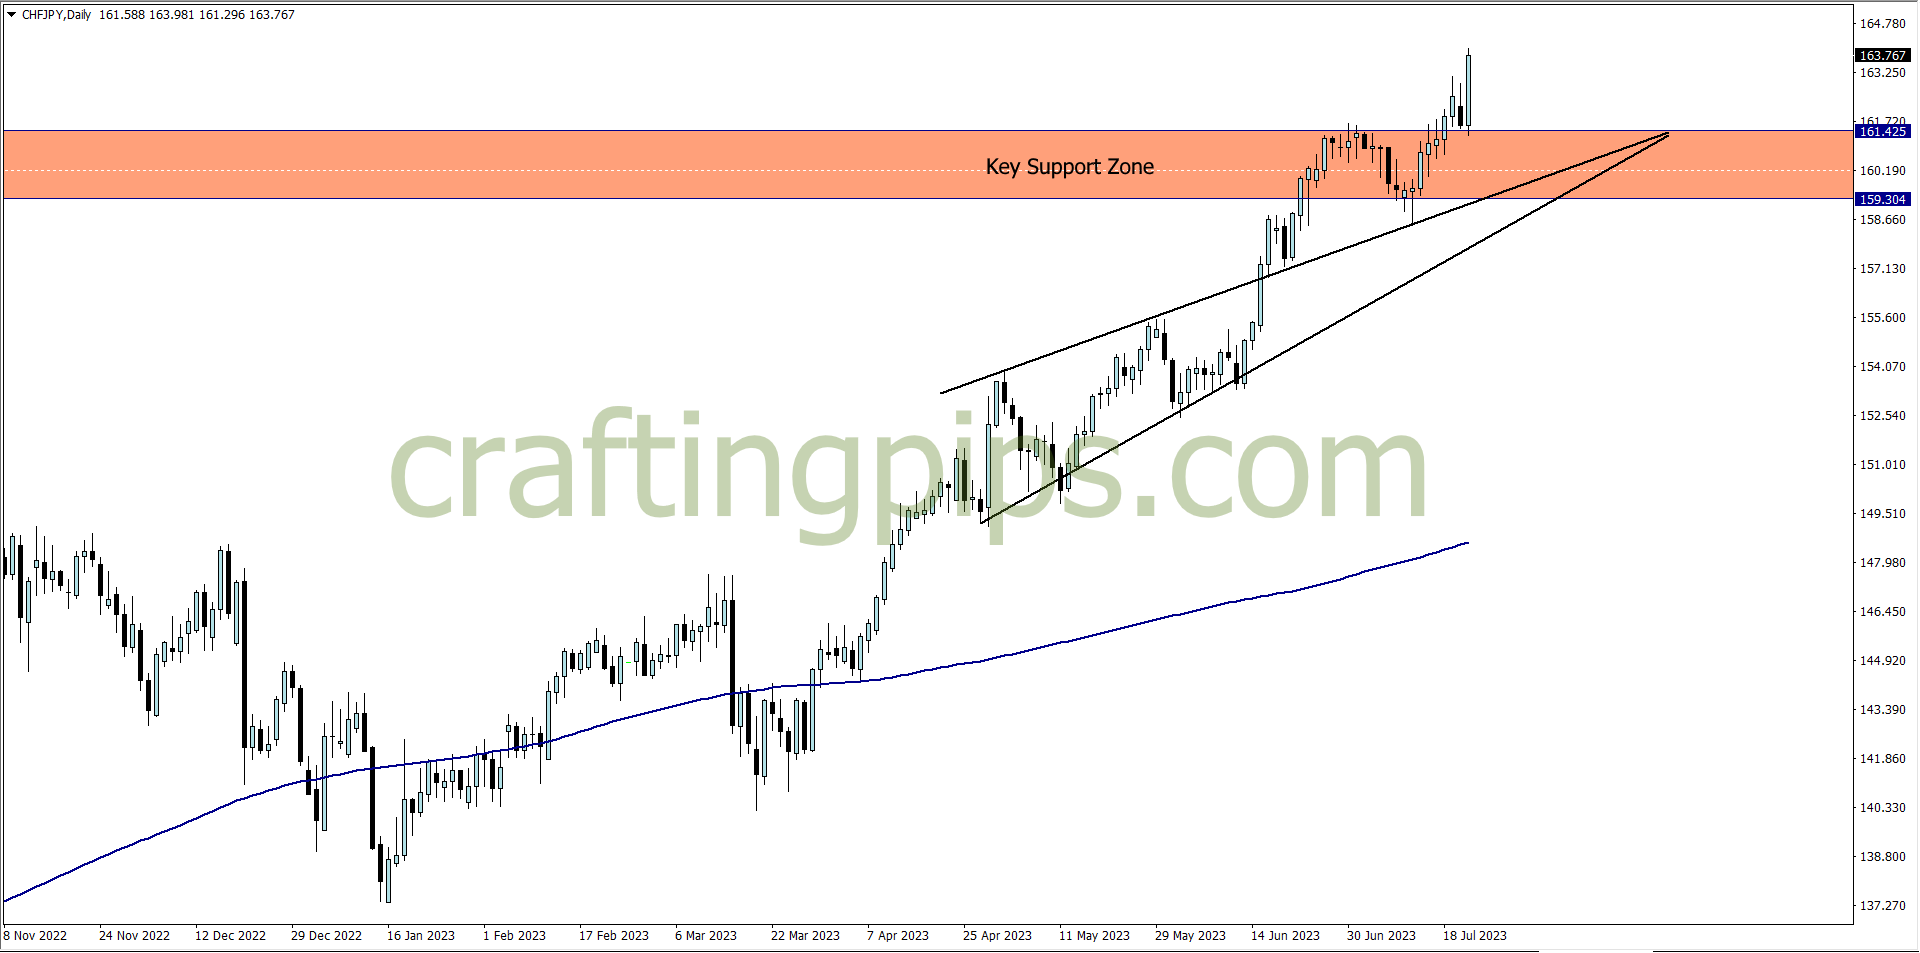
Resistance level 163.720 is a new level CHF/JPY has reached in over 20 years.
Last week’s close, CHF/JPY gave a bold statement that: “Sellers you are doomed”
This week we just have to be patient enough to get a buy opportunity if we decide to trade on the lower time frame, and project another 100 to 25o pips before the close of the week
Mind you, this setup has got no roof/resistance in sight, so a reversal at any time is not out of place. So if you are trading it, do so with caution
NOTE:
-
THE FUNDED TRADER: https://dashboard.thefundedtraderprogram.com/purchasechallenge-n/?sl=3322 (use the coupon code: THE0CRAFTER)
-
MY FUNDED FX: https://myfundedfx.tech/purchasechallenge/?sl=758
- BESPOKE FUNDING PROGRAMME: https://www.bespokefundingprogram.com/The_Crafter?ref=The_Crafter