Hey traders,
let’s hit them charts:
1. USD/CHF
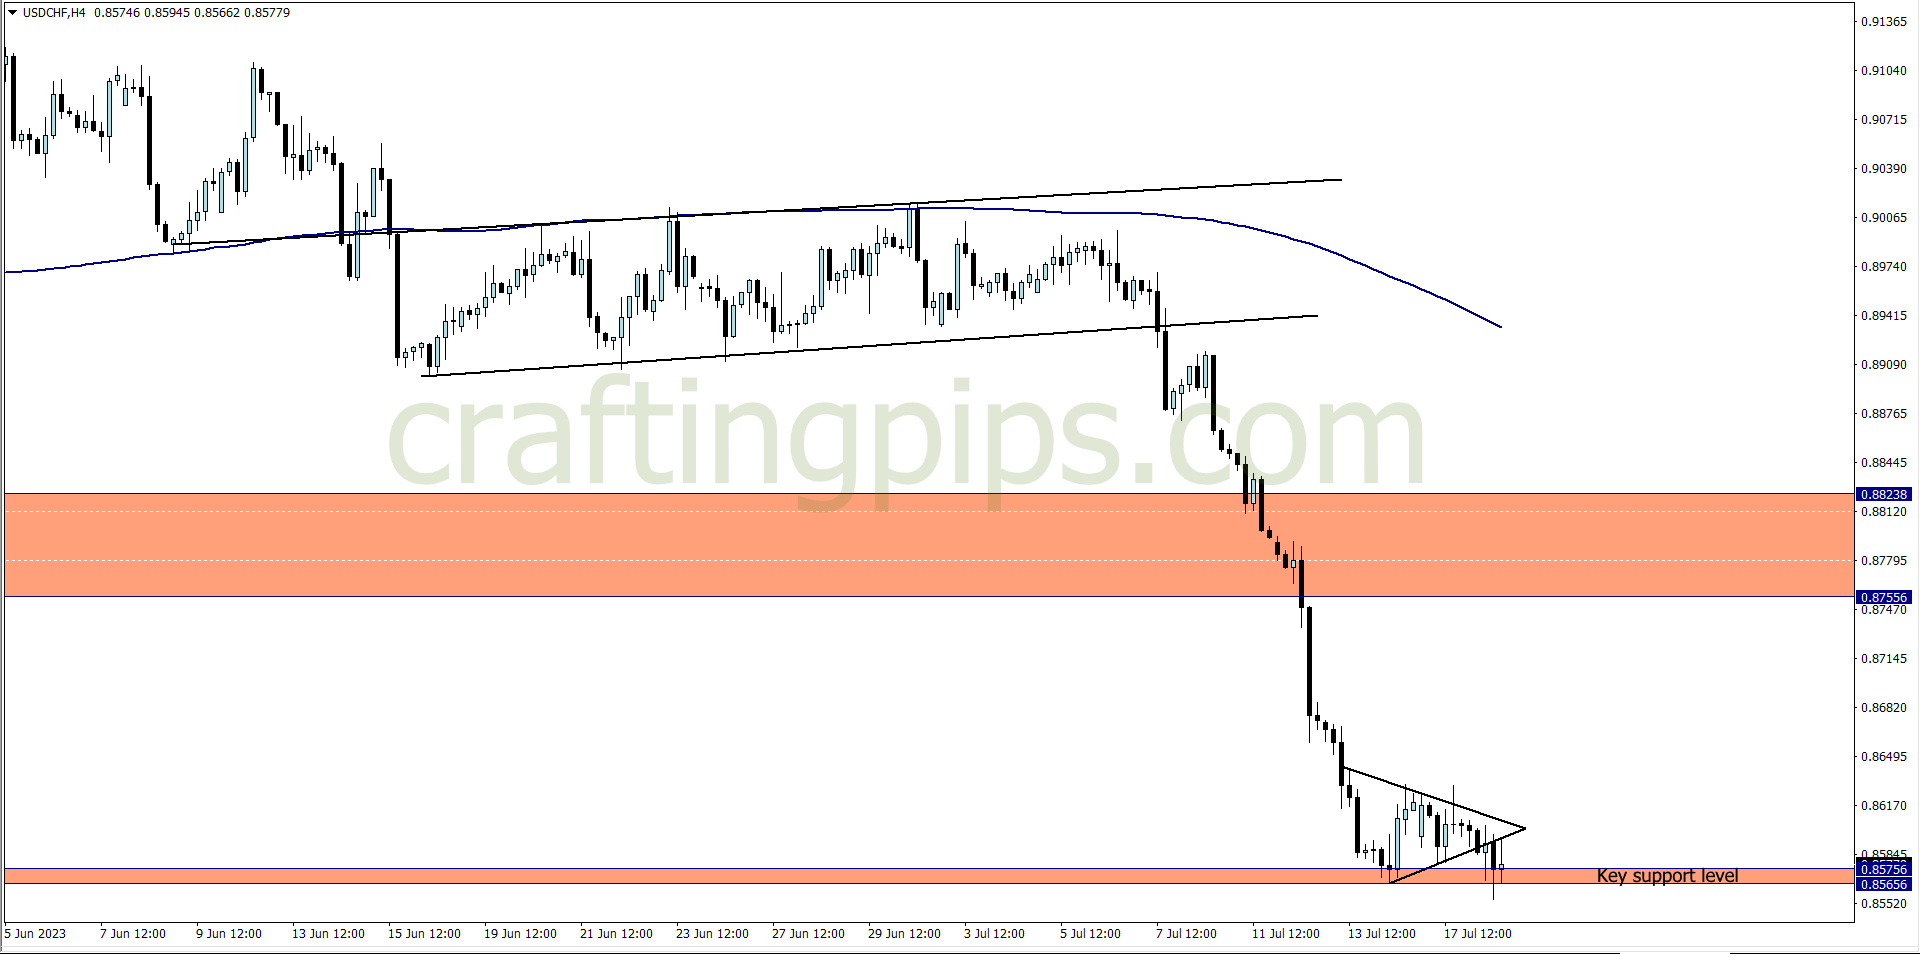
After price on the USD/CHF broke below the ascending channel, price went through a weekly key support zone last week like it was nothing.
Over 300 pips was spewed after the ascending channel got broken. This week we can see the sellers taking a breather, as a pennant formation at this point signifies a trend continuation pattern.
The last time the current support zone (where the pennant rests) was broken was twelve years ago, so the consolidation pattern is expected.
To trade this pennant formation effectively, is to wait for the close of the daily candlestick, and see if price breaks below the current support zone.
If that happens, we could be lucky to catch 100 – 200 pips before the trading week ends.
2. CHF/JPY
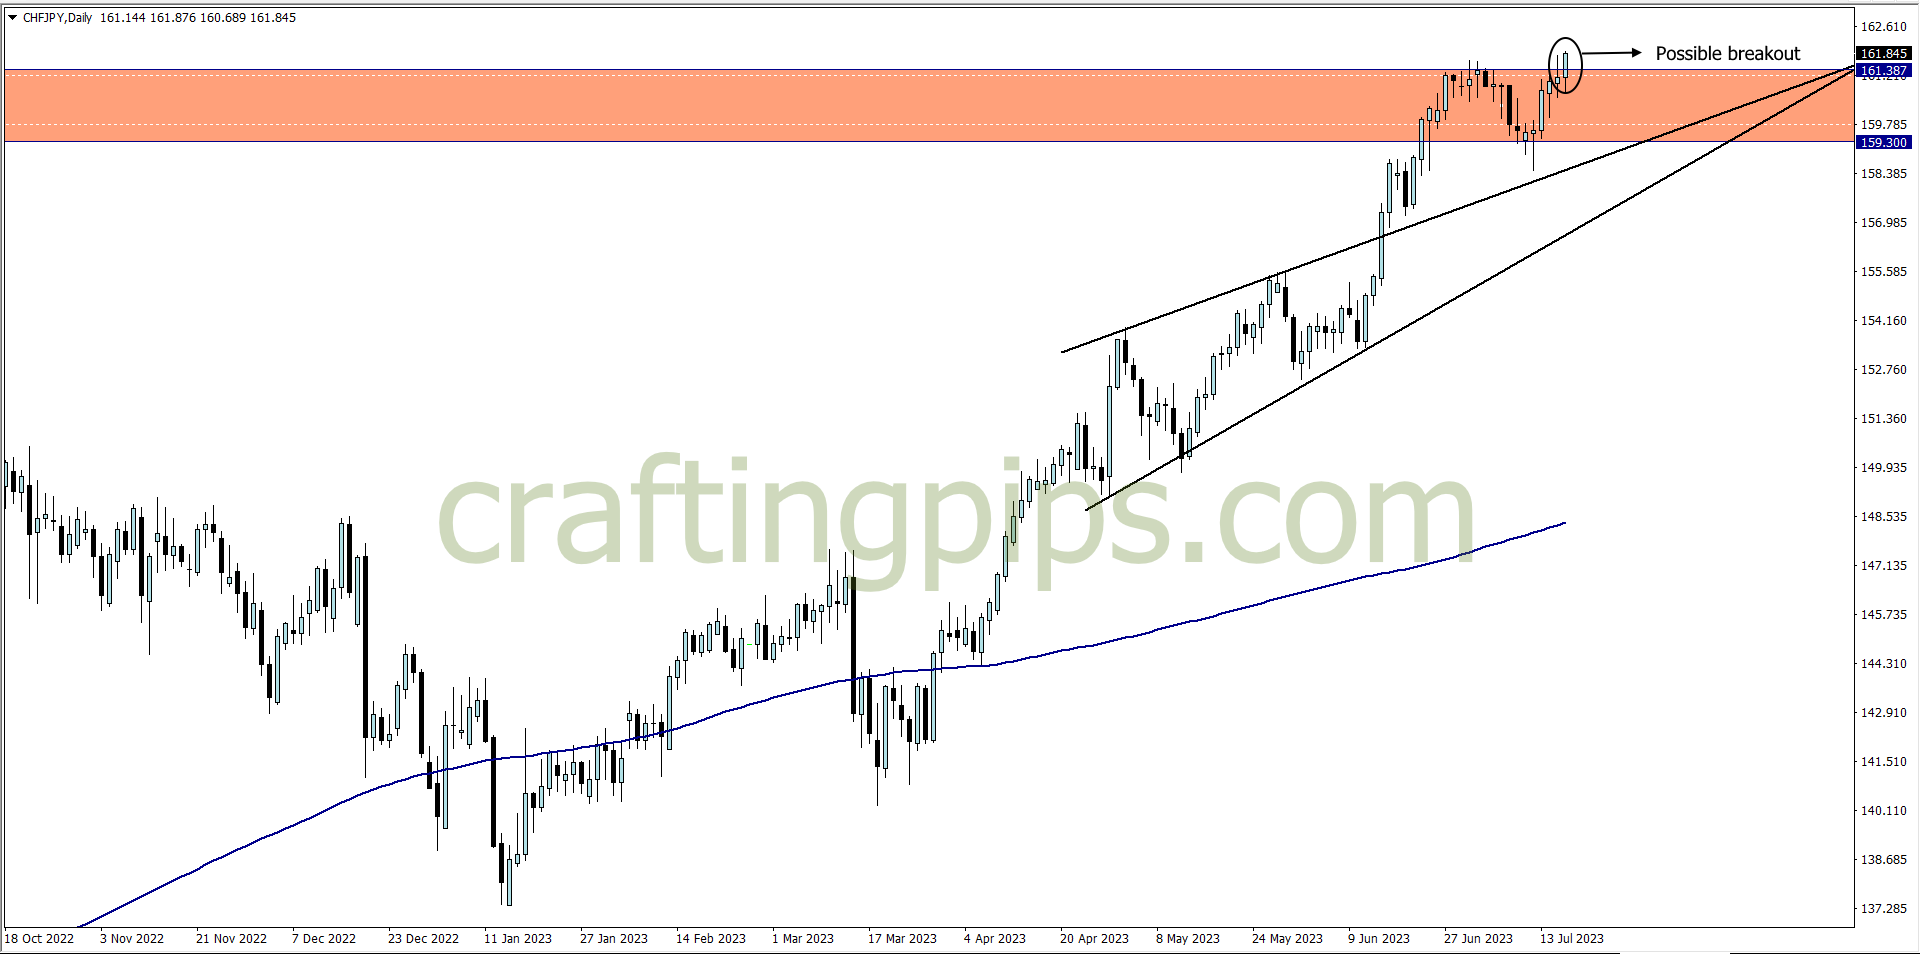
A possible breakout can be spotted on the CHF/JPY, after a bounce off a previous resistance level, which now serves as a support level.
Let’s not forget that CHF/JPY is at the highest it has even been, since the inception of time (lol). This means this pair has no ceiling, but based on the last low it made, we can project that 150 to 300 pips is not out of reach.
First though we need to be patient enough to see if price will close above the previous high
What say you?
NOTE:
-
THE FUNDED TRADER: https://dashboard.thefundedtraderprogram.com/purchasechallenge-n/?sl=3322 (use the coupon code: THE0CRAFTER)
-
MY FUNDED FX: https://myfundedfx.tech/purchasechallenge/?sl=758
- BESPOKE FUNDING PROGRAMME: https://www.bespokefundingprogram.com/The_Crafter?ref=The_Crafter