Hey traders,
let’s see what the charts have for us:
1. USD/CAD

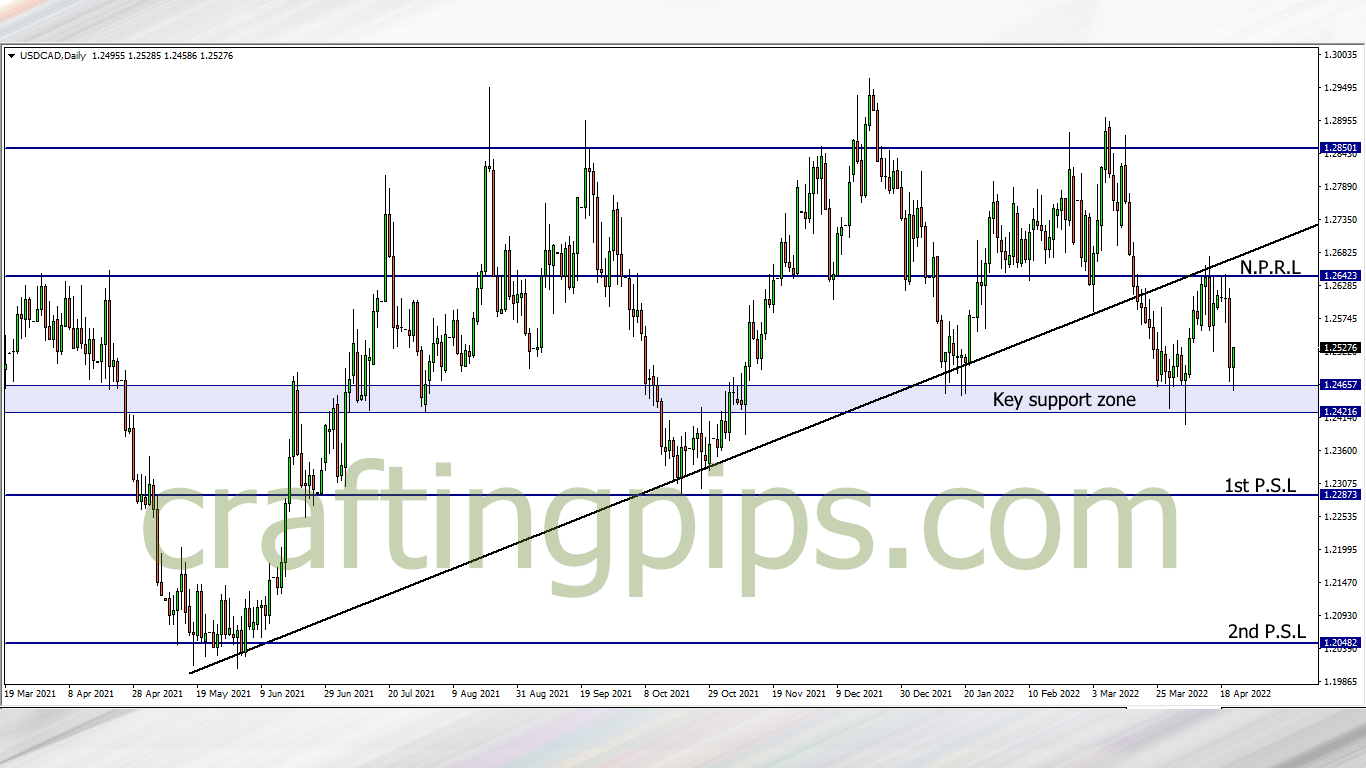
USD/CAD has again reached a key support zone when viewing the daily time frame.
This may encourage buyers into the market which may take price back to resistance level 1.26423 if the bears are not aggressive.
However, if we go get price breaking the key support zone, then price will most likely slip further down to the next two possible support levels (1.22873 & 1.20482)
2. GBP/CHF

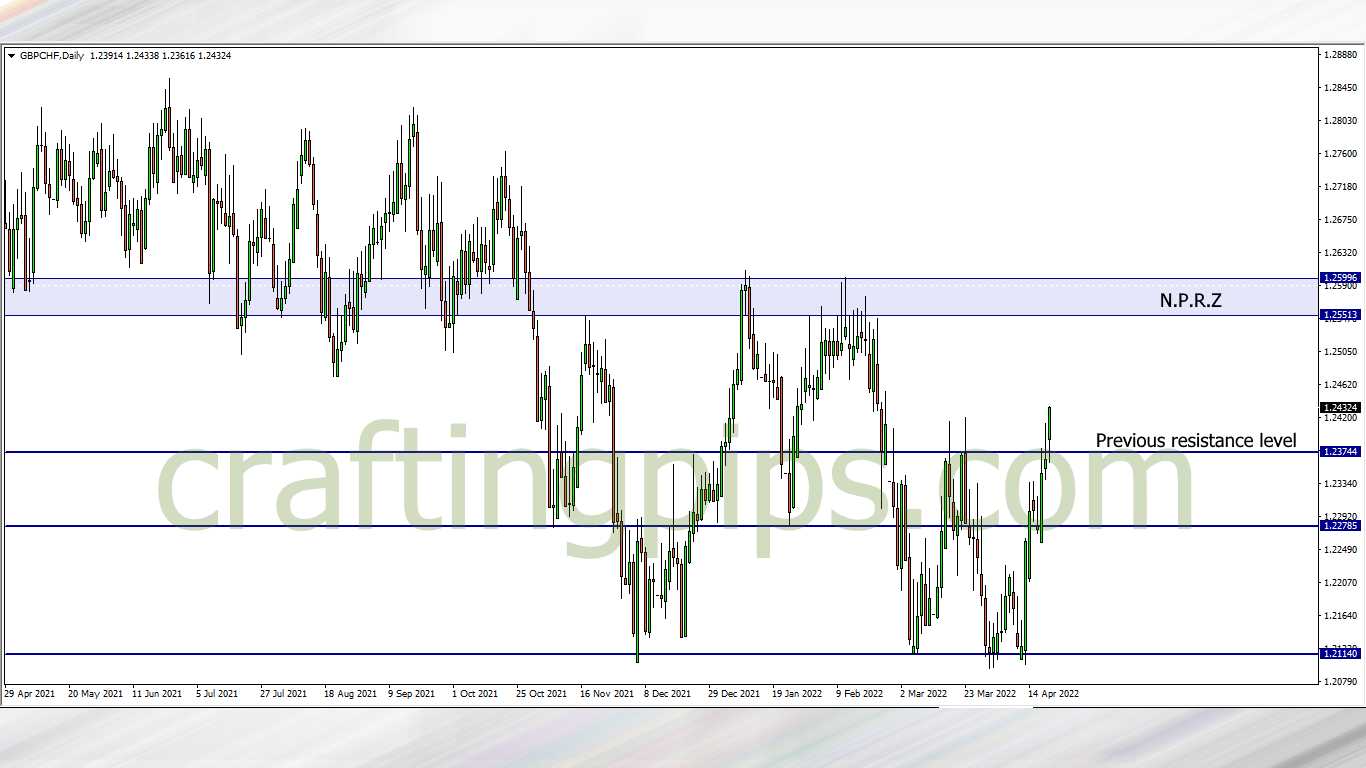
The bullish campaign continues on the GBP/CHF after the 1.24123 was broken.
If the daily candlestick closes bullish, there is a huge probability that 1.25513 will be the next destination for the buyers currently riding the market.
3. NZD/JPY

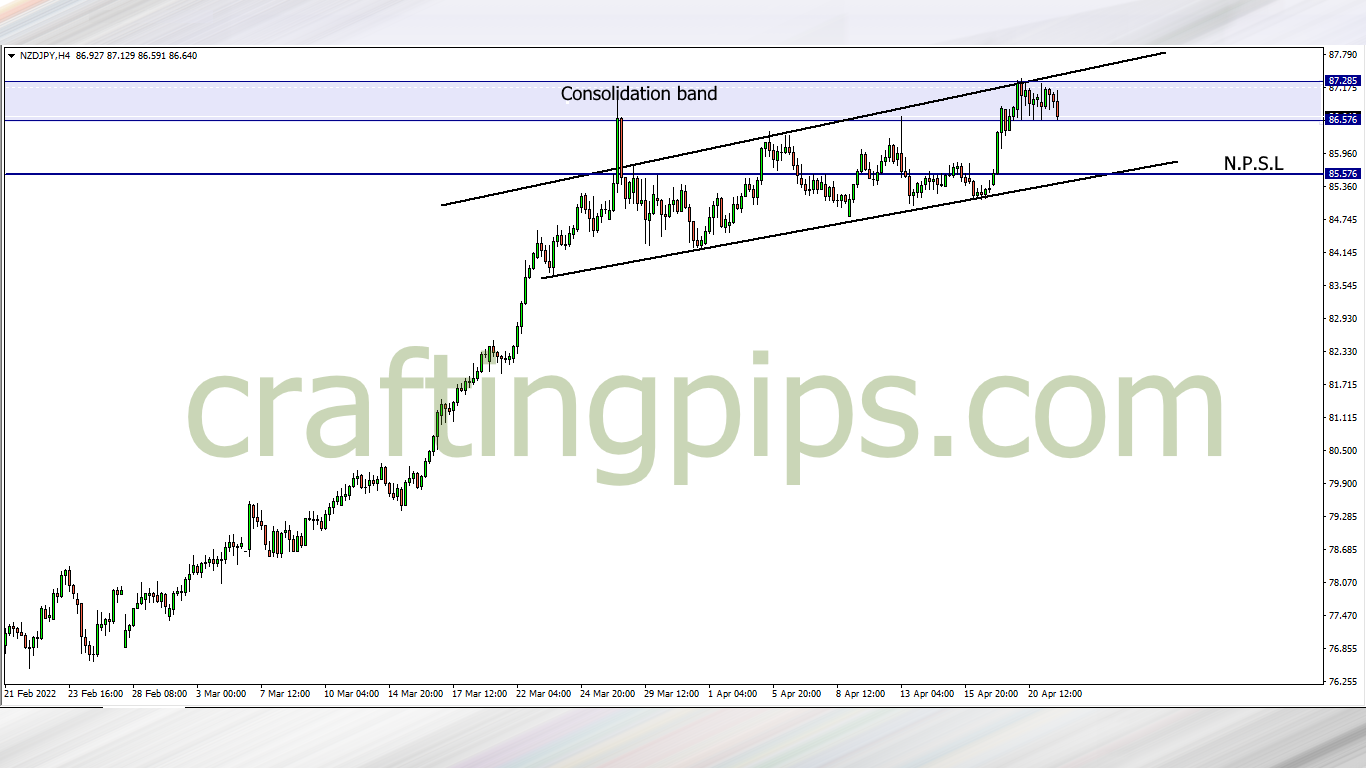
On the NZD/JPY, during a bullish campaign, buyers got trapped within the consolidation band for close to 24 hours, and weakness can be seen on the 4-hour time frame as we see sellers slowly forcing price below the consolidation band.
If the bearish breakout is confirmed, then price may fall back to support level 85.576
What say you?
Traders who are interested in joining our FREE trading group on Telegram, where trade ideas and trade-related topics are discussed, which could assist your trading career while being infected by positive vibes
hit us on Pip Crafters