One indicator, that has constantly showed up for me is the stochastics. It stands tall as a powerful indicator that helps me gauge overbought and oversold conditions in the market.
In this article, I will take you on an exciting journey, uncovering the secrets of stochastics and teaching you how to wield it effectively. Get ready to elevate your trading game with a touch of wit and wisdom!
Understanding Stochastics:
To harness the true potential of stochastics, we must first grasp its underlying concept. Developed by George C. Lane, stochastics is a momentum oscillator that compares a security’s closing price to its price range over a given period.
It consists of two lines, %K and %D, which fluctuate between 0 and 100, revealing potential buying and selling pressure.
Components of Stochastics: To use stochastics effectively, we need to understand its key components:
a) %K Line: The %K line represents the current closing price’s position within the selected time period’s price range. It is highly responsive to market fluctuations and often considered the faster line.
b) %D Line: The %D line is a smoothed version of the %K line, further reducing volatility and providing a clearer picture of the market’s momentum.
c) Overbought and Oversold Levels: Stochastics employs two reference lines, typically set at 80 for overbought and 20 for oversold levels. These levels help identify potential reversals when the %K or %D line crosses them.
Before we go any further I want to address the elephant in the room.
There are 4 major misconceptions about stochastics, which are:
Misconception 1: Stochastic Indicators Predict Price Movements:
While stochastic indicators are valuable tools, they are primarily used to identify potential trend reversals or overbought/oversold conditions in the market. They provide insights into the momentum of price movements but do not offer precise predictions.
Relying solely on stochastic indicators for making investment decisions can be risky, as other factors should be considered to form a comprehensive analysis.
Misconception 2: Stochastic Indicators Work Equally Well in All Market Conditions:
In reality, stochastic indicators are most effective in range-bound markets where prices exhibit regular oscillations between support and resistance levels. During trending markets, stochastic indicators may remain in overbought or oversold territory for extended periods, potentially generating false signals.
Traders should consider using other indicators or techniques to complement stochastic analysis during trending phases.
Misconception 3: Stochastic Indicators Are Standalone Tools:
Some traders mistakenly believe that stochastic indicators are standalone tools that provide complete trading signals. However, relying solely on stochastic indicators without considering other technical indicators or fundamental analysis can lead to poor decision-making.
It is crucial to use stochastic indicators in conjunction with other tools to gain a holistic view of the market and validate signals. Combining stochastic indicators with moving averages, trend lines, or volume analysis can enhance their effectiveness and reliability.
Misconception 4: Stochastic Indicators Have Fixed Settings:
Stochastic indicators have two main components: %K and %D.
%K represents the current closing price relative to the high-low range over a specific period, while %D is a moving average of %K. The default settings for stochastic indicators are often 5, 3, 3. Other commonly used settings for Stochastic include 14, 3, 3, and 21, 5, 5. fixed or universally applicable.
Traders should customize the settings based on the market’s characteristics, time frame, and the asset being analyzed. Different settings can result in variations in signals and adaptability to different market conditions.
Misconception 5: Stochastic Indicators Guarantee Profitable Trades:
While stochastic indicators can provide valuable insights into market conditions, it is important to note that no indicator guarantees profitable trades. The market is influenced by various factors, including fundamental news, economic events, and geopolitical developments, which stochastic indicators alone cannot capture.
Successful trading requires a combination of technical analysis, risk management, and sound judgment. Traders should view stochastic indicators as one tool among many in their trading arsenal.
That said, for the purpose of this article, I will be sharing 3 ways I effectively use the stochastic, alongside other indicators (candlestick patterns, 200 moving average and trendlines)
1. Confirmation tool for overbought and oversold conditions in a ranging market:
Before we use stochastic, let’s first of all build a case.
(a) The Range
Let’s start by first determining what a range is by using horizontal lines and it’s relationship with the 200 moving average, and candlestick formation.
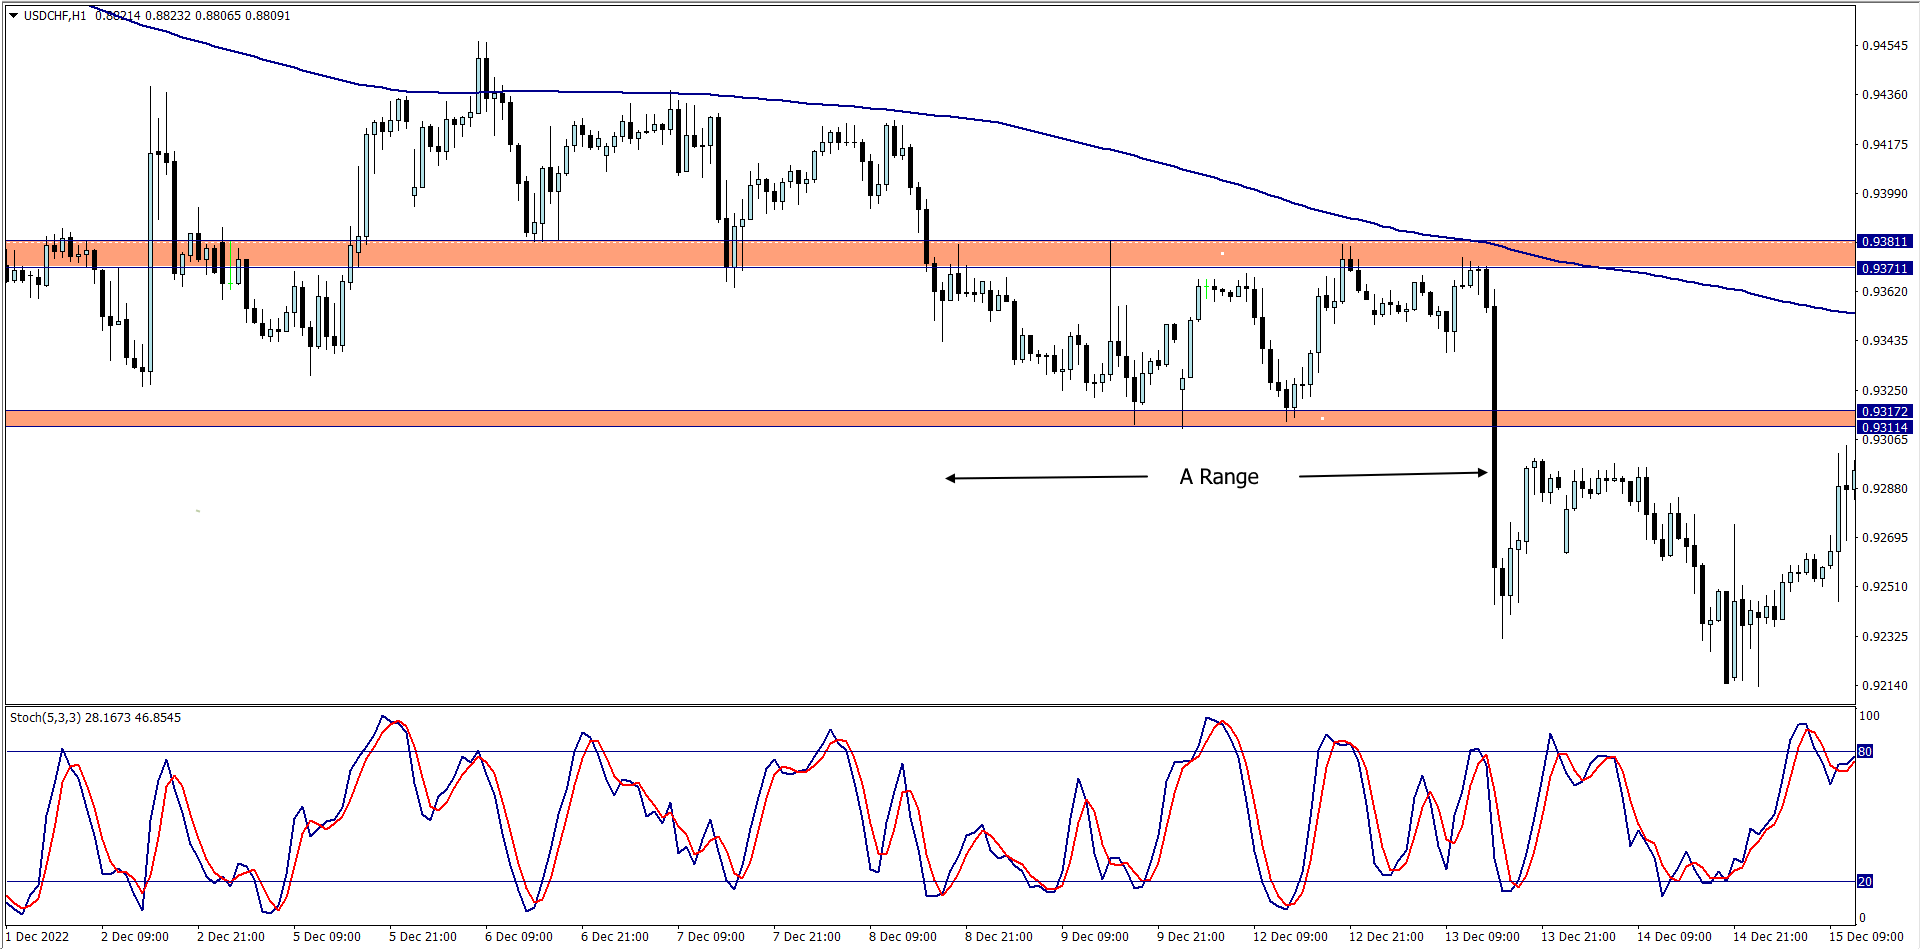
The range spotted lasted for almost 3 days, but what makes it promising is the fact that the range was formed below the 200 moving average, which gives the resistance zone more credence
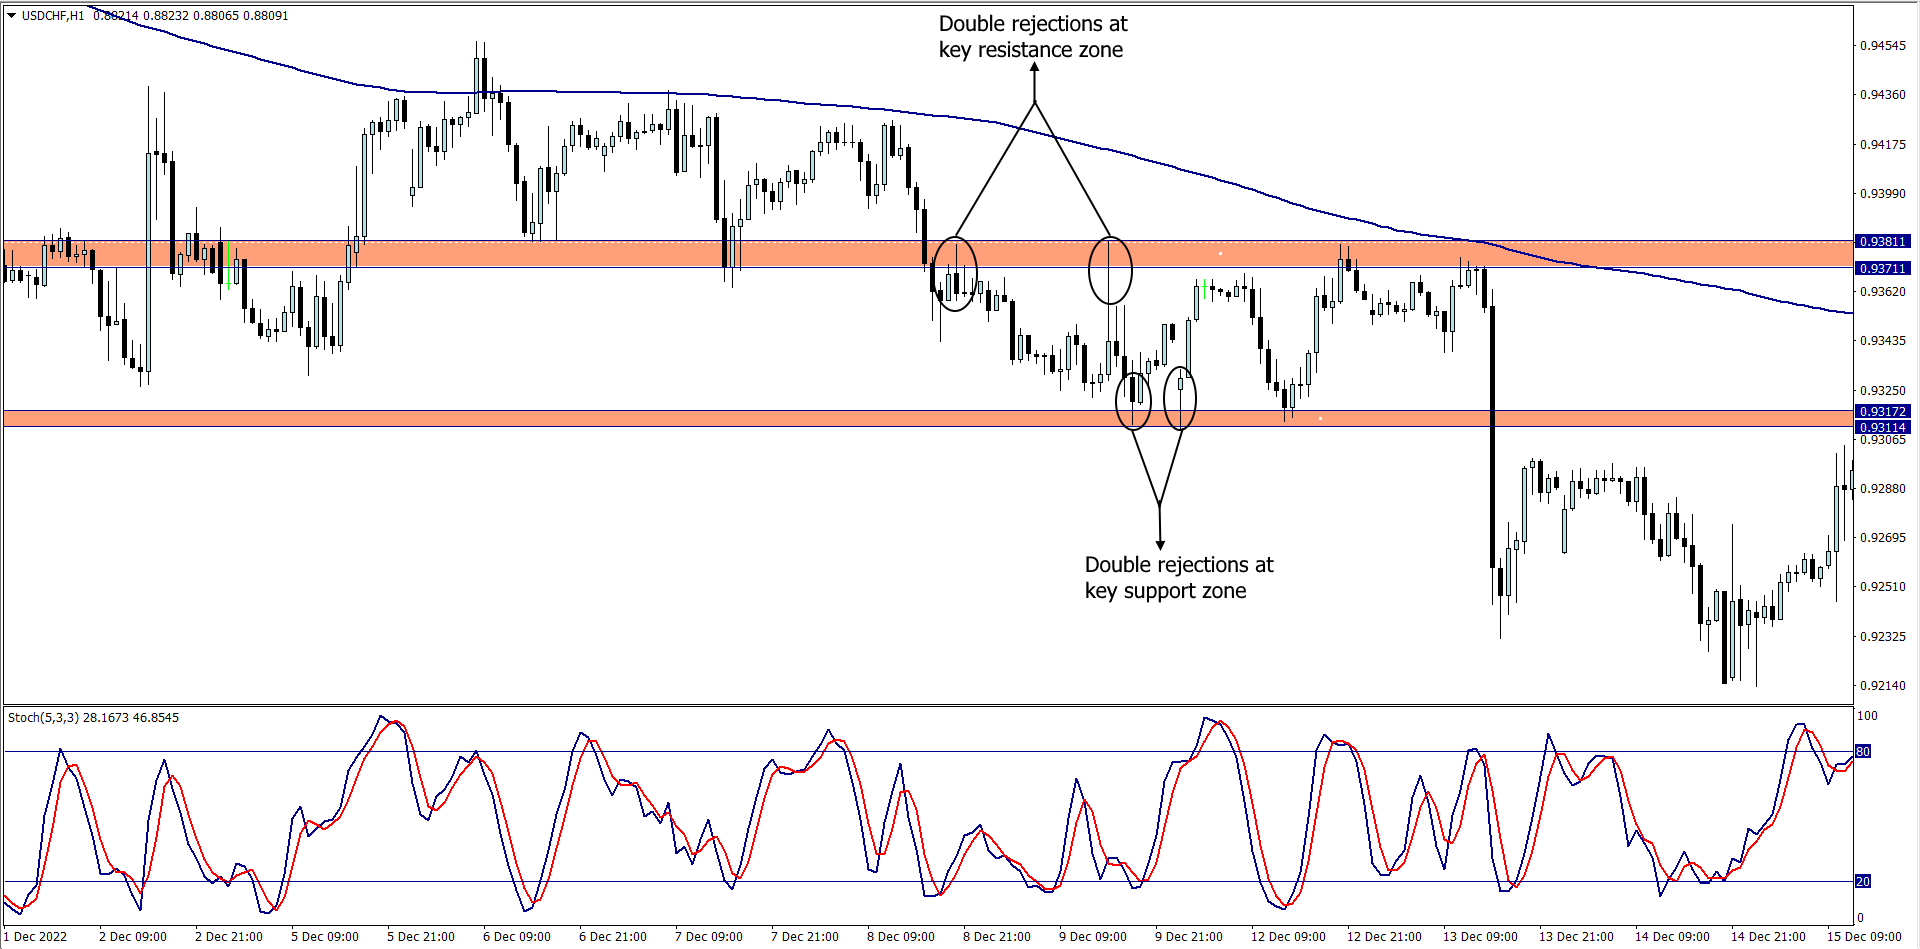
(b) The Rejections
Before we say price is ranging or consolidating, first we need to see minimum of two rejections (both at a key resistance and key support level/zone)
(c) The Entries
Now that a range is ascertained, let’s hunt for entries by combining our case study to form a story that will promote our bias
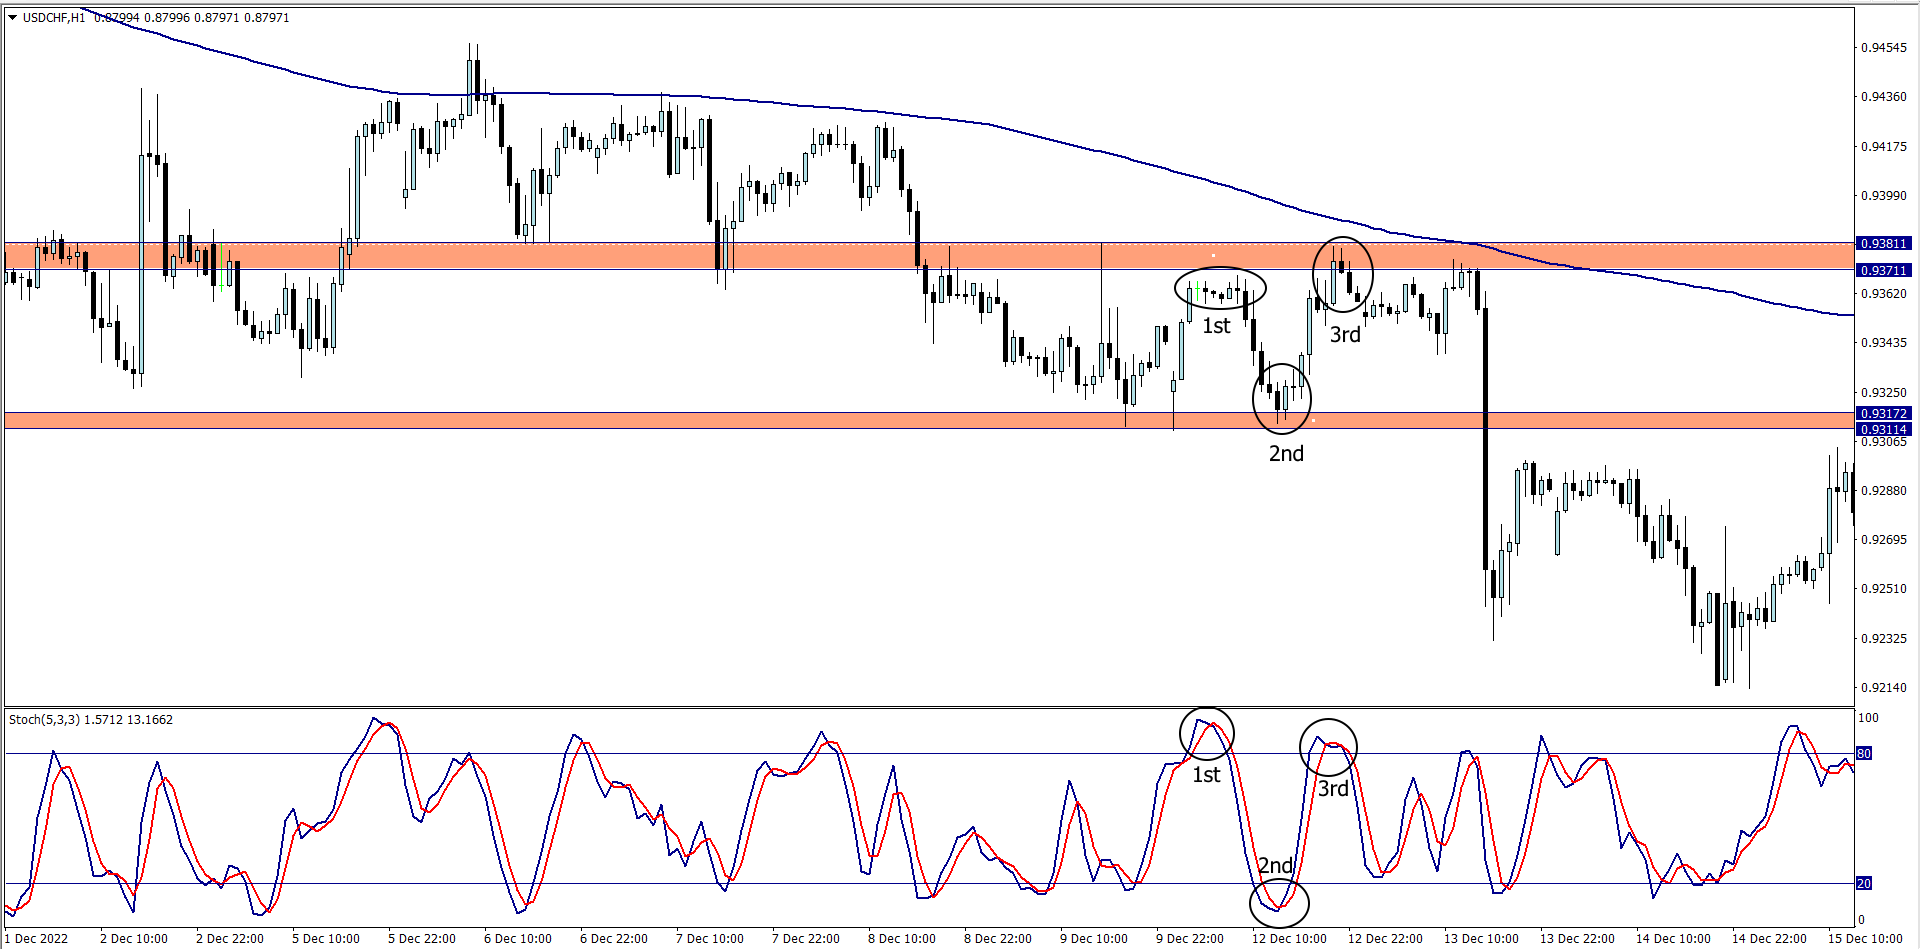
In order for us to appreciate the stochastic as a confirmation tool, let’s combine the info in all three charts:
- We made sure that there were at least two rejections at key resistance and key support zone. This made us confident that we were dealing with price trapped within a range
- Under sub-heading “the entries” you will see that the 1st sell opportunity had multiple doji candlesticks around a key resistance zone, and at the same time the stochastic signaled overbought (way above 80). The 200 ma above the resistance zone is just an icing on the cake
- The 2nd entry which was a buy signal became viable after a bullish engulfing candlestick emerged at a key support zone. At the same time the stochastic gave us an oversold signal (below 20)
- The 3rd and final entry was a sell signal which became viable after the formation of 3 black soldiers at a key resistance zone, and at the same time the stochastic gives us an overbought signal
2. Confirmation tool to detect pullback exhaustion after a breakout:
When I am trading channels or any chart pattern, I sometimes use the stochastic to detect when the bears or bulls get exhausted in pullbacks, so that I could either buy/sell, or add to my initial position.
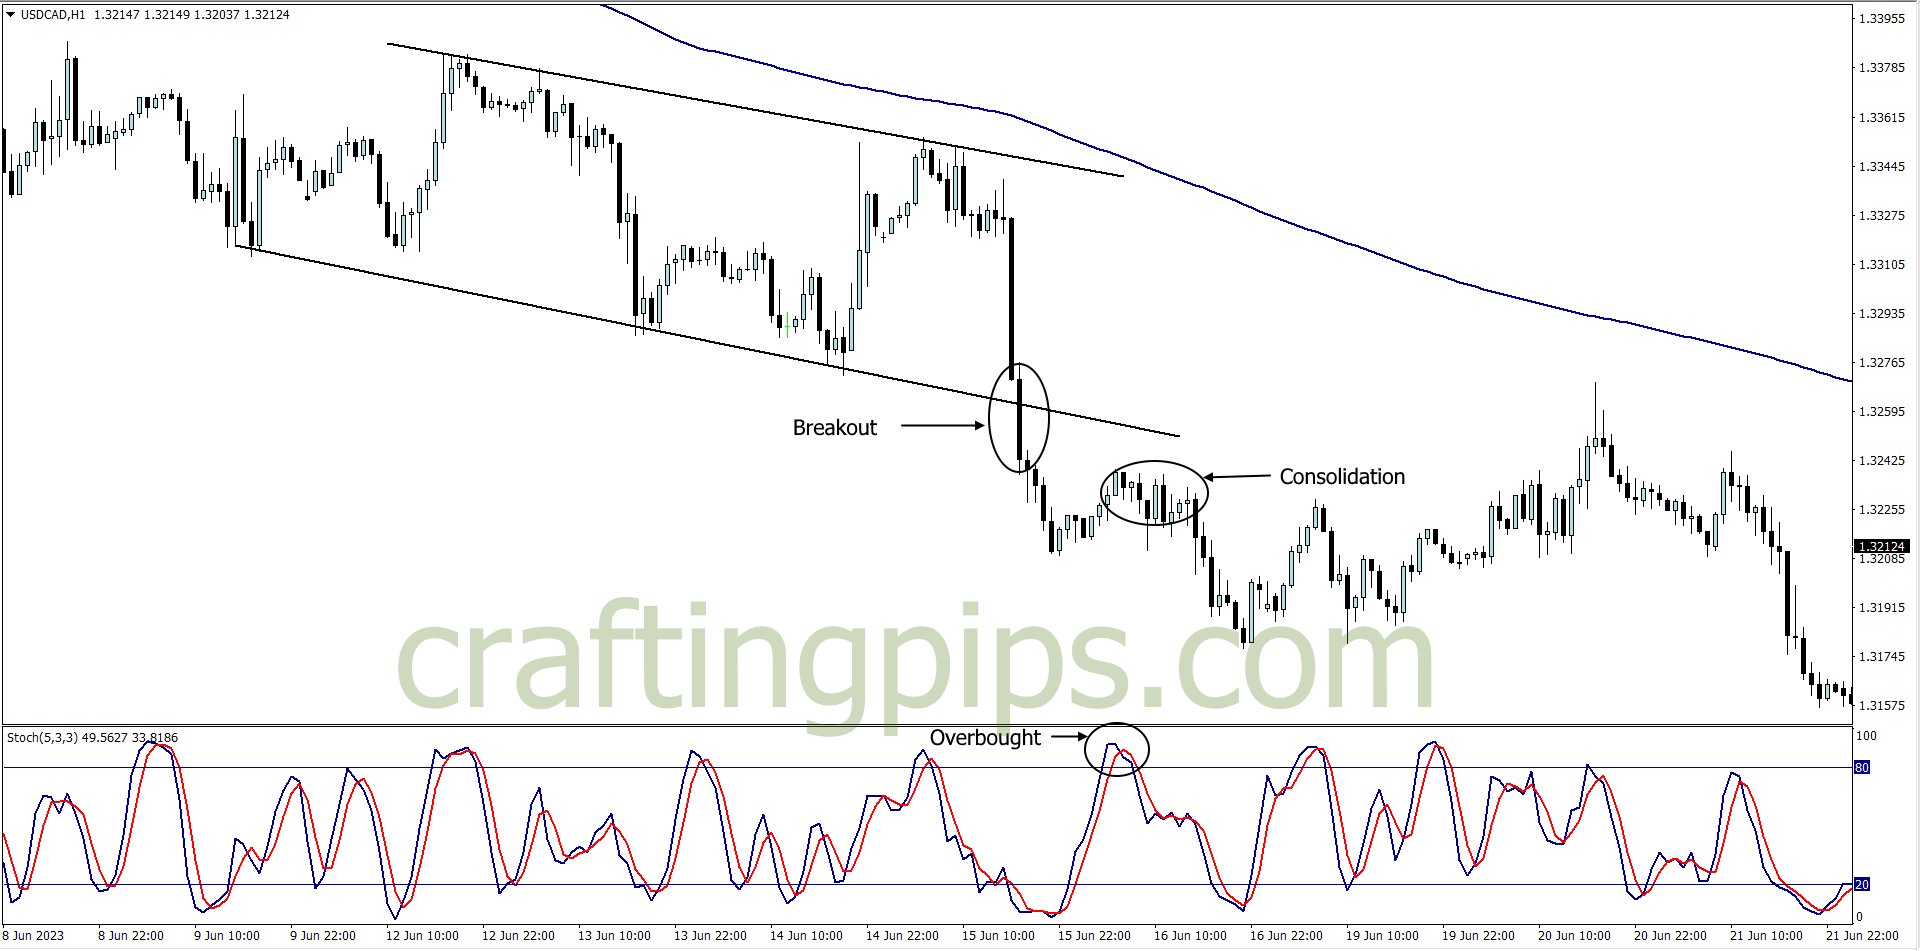
In the chart, we can see a strong breakout below the channel. Conservative traders may choose not to sell immediately, but wait for a pullback, and sell only after the pullback is exhausted. If that’s your thing, the stochastic serves this purpose of a confirmation tool
The chart clearly does not only show us price consolidating close to the previous support that is currently a resistance level, but it also shows us an overbought stochastic, which is a huge confirmation to hit the sell button.
This method can also be repeated in a bullish market with bullish pattern breakout and retest.
3. Detecting bearish and bullish divergence:
This is my bread and butter when using the stochastic. If used correctly, your win rates in some weeks could hit 100% just trading divergence.
So, how does divergence work?
Divergence occurs when the price moves in the opposite direction of the stochastics indicator. This phenomenon often serves as a powerful signal, suggesting an impending trend reversal
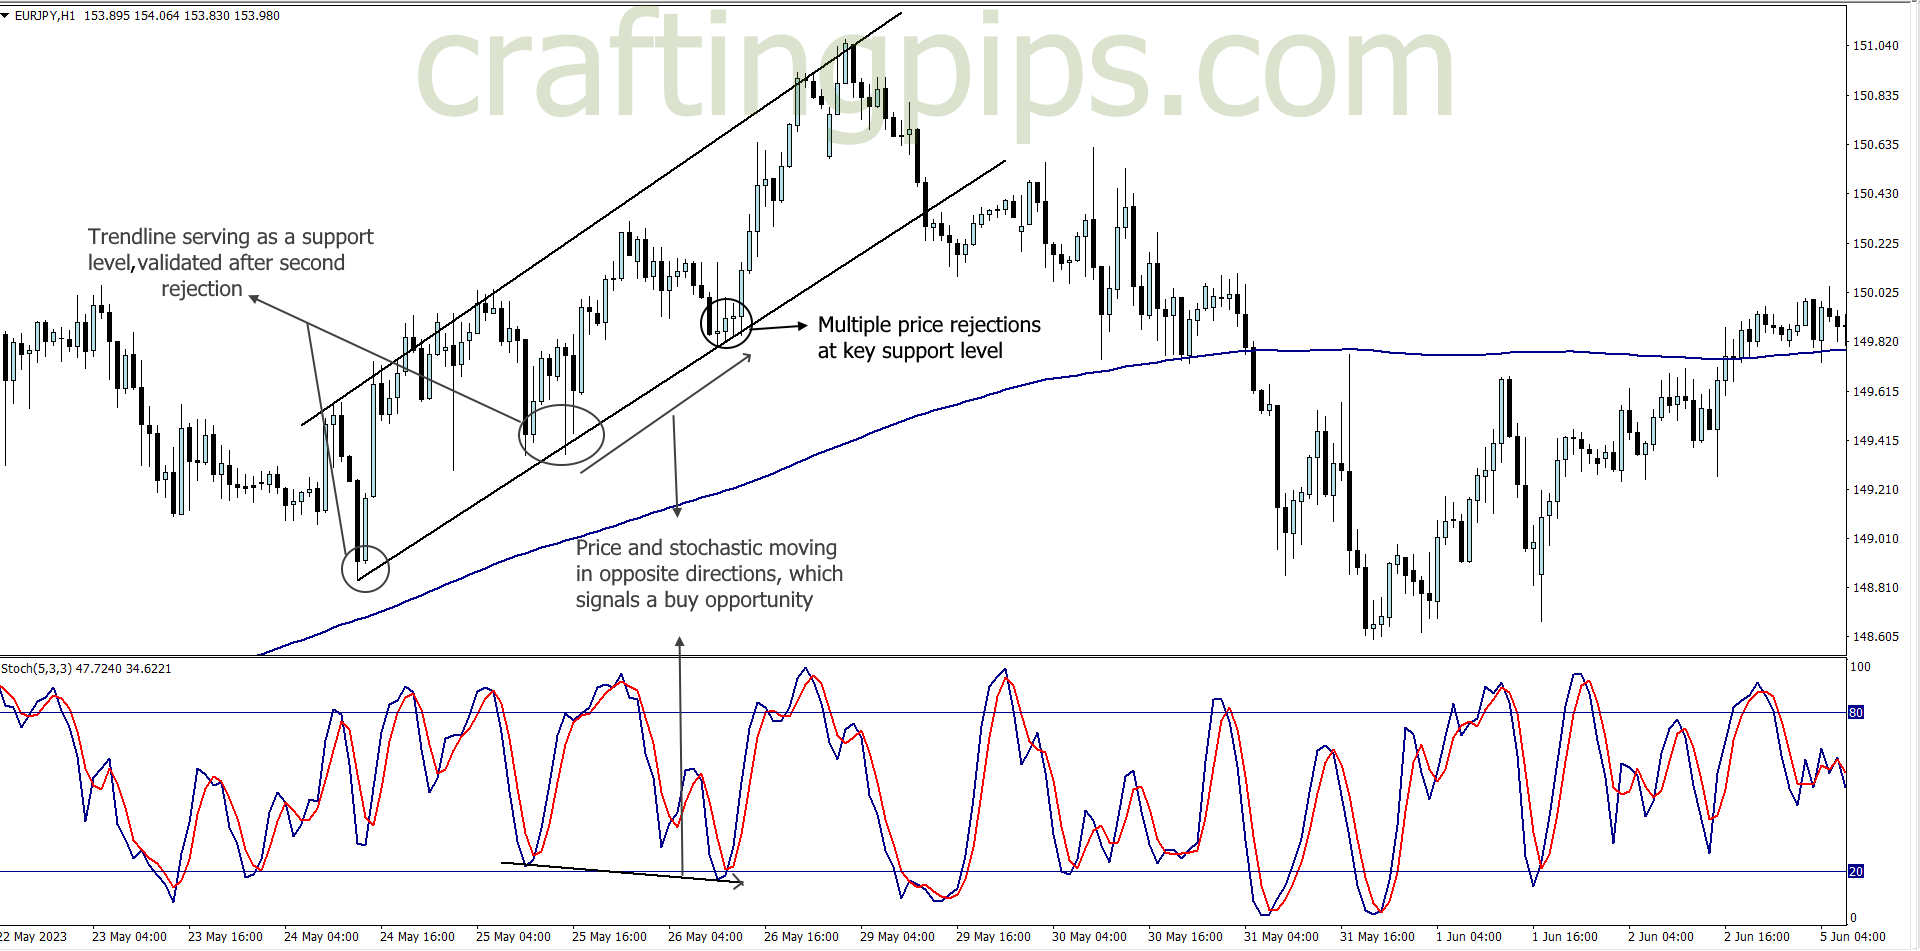
In the EUR/JPY chart above there are 3 confirmations for a buy opportunity, and the stochastic as an additional tool, plays its role like a cherry on the cake
Let’s check out all the buy confirmations in the EUR/JPY chart:
- Price is above the 200 moving average, so hunting for a buy signal is not out of place
- Price established the probability of a third bounce after multiple rejections were spotted using the candlesticks
- The stochastic indicator gives us a beautiful bullish divergence, signifying price reversal is just around the corner
In Conclusion
Congratulations on embarking on your stochastics journey! Armed with the knowledge of how stochastics works and its applications in forex trading, you are now equipped to take calculated steps towards market domination.
By using stochastics to identify overbought and oversold conditions, spotting divergences, and combining it with sound risk management, you can refine your trading skills and unlock new opportunities.
So, go forth with wit and wisdom, and may your stochastics mastery lead you to forex trading success!
NOTE:
-
THE FUNDED TRADER: https://dashboard.thefundedtraderprogram.com/purchasechallenge-n/?sl=3322 (use the coupon code: THE0CRAFTER)
-
MY FUNDED FX: https://myfundedfx.tech/purchasechallenge/?sl=758
- BESPOKE FUNDING PROGRAMME: https://www.bespokefundingprogram.com/The_Crafter?ref=The_Crafter