Hello traders,
it’s almost mid-week, let’s see what the charts have for us:
1. USD/JPY

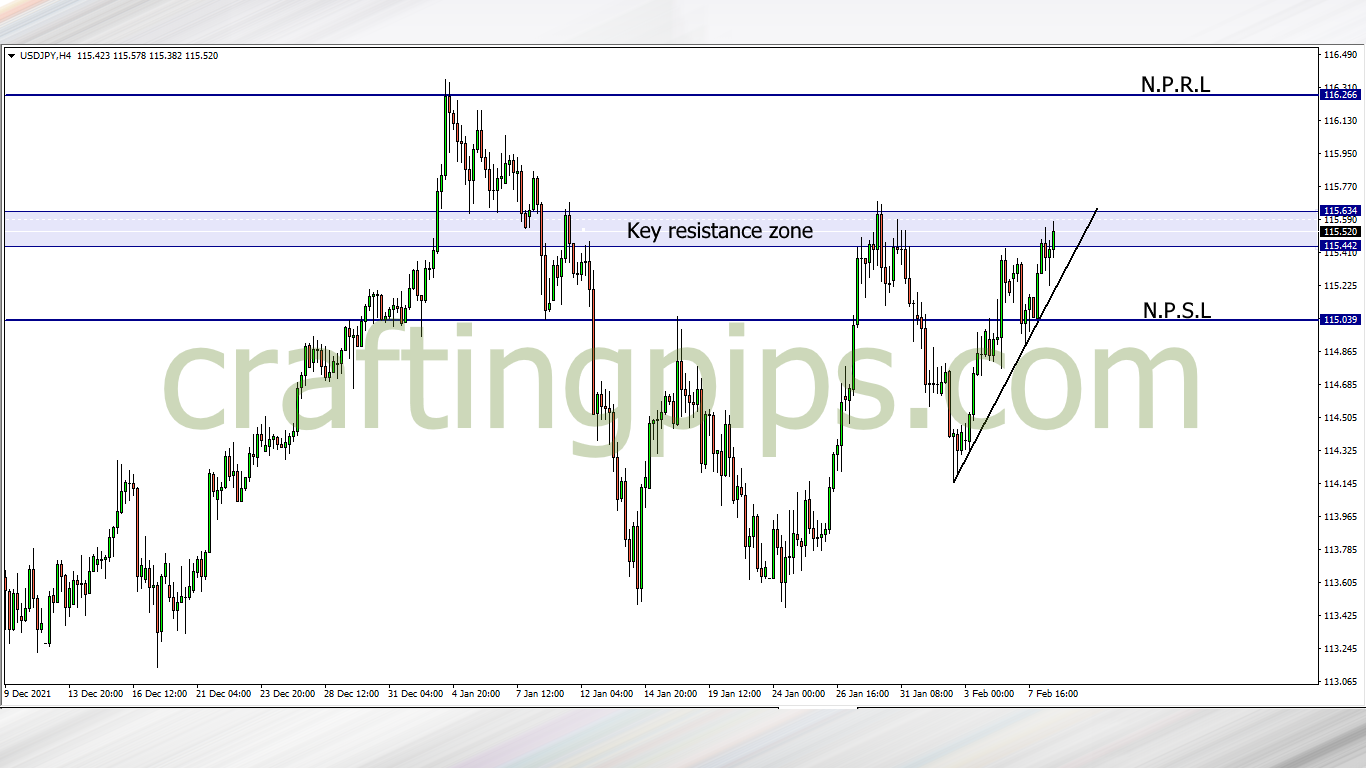
On the USD/JPY we can see price lurking within the key resistance zone, hence forming a double top and a steep ascending trendline which serves as a support.
If price breaks the resistance zone this Wednesday, we may see price hit 116.266 as the next resistance level. However, if price fails to break the key resistance zone, and the ascending trendline is broken, we may see price return to support level 115.039
2. GBP/JPY

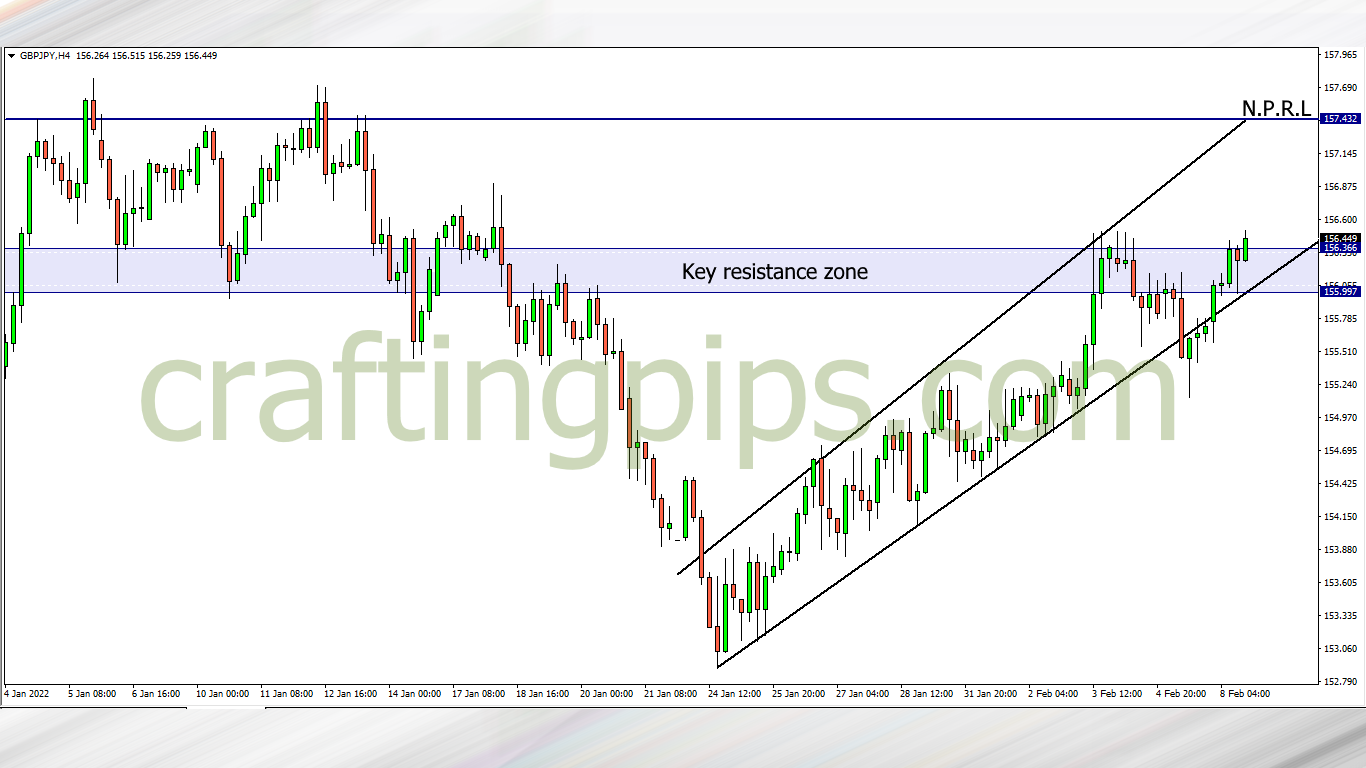
Price has broken out of the key resistance zone.
Conservative traders will wait to see how the daily candlestick closes before joining the buyers to the next possible resistance level (157.432)
The reason for this is because:
We may see a deep pullback that could hit the stop loss of traders who bought from a lower time frame.
3. AUD/JPY

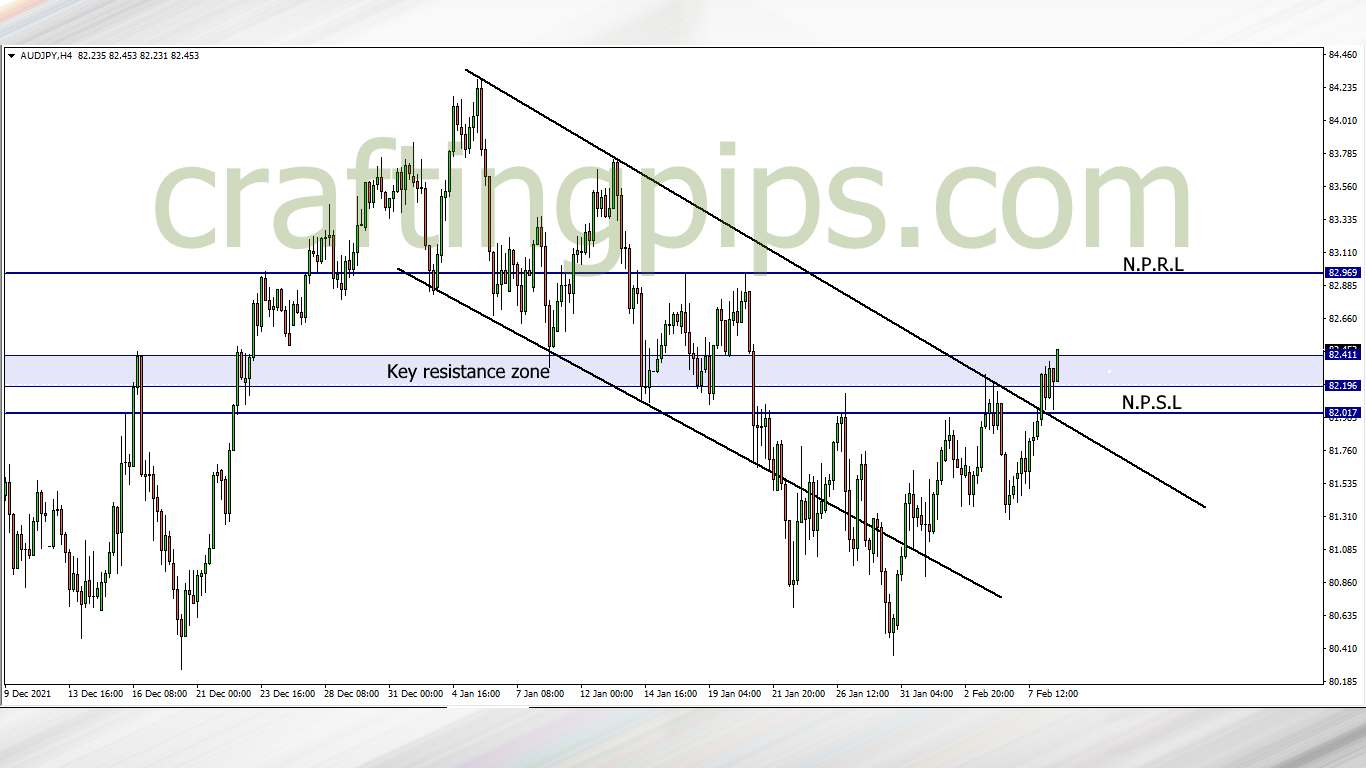
Price has broken out of the descending channel, retested it, and has started an upward move to the next possible resistance level (82.969)
Note that this setup could be destroyed before the 11 pm candlestick emerges. So if we are planning to go bullish, it will be important to wait and see how the present daily candlestick closes.
If the buyers fail to take price to 82.969, we may see price re-visit support level 82.017
What say you?
Traders who are interested in joining our FREE trading group on Telegram, where trade ideas and trade-related topics are discussed, which could assist your trading career while being infected by positive vibes
hit us on Pip Crafters