Hello traders,
let’s hit them charts:
1. USD/JPY
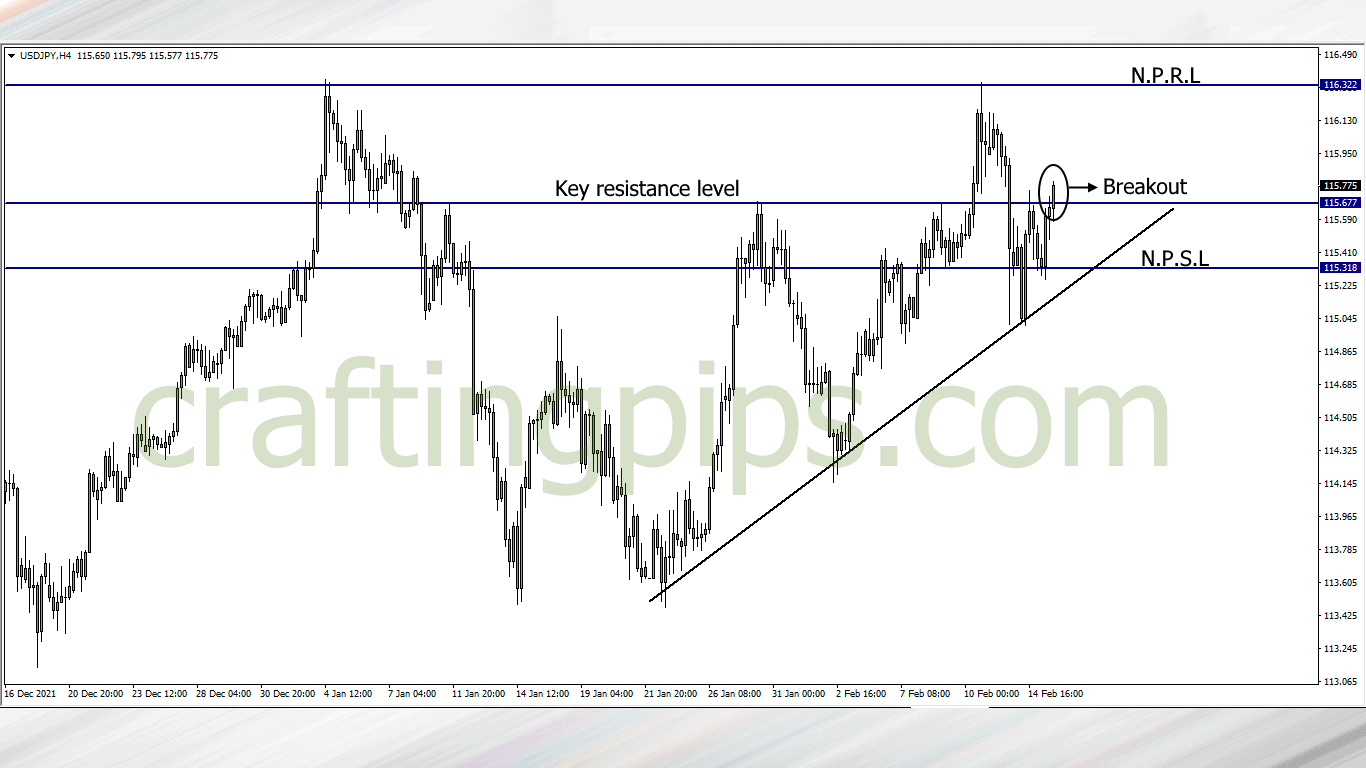
The higher lows formed by the USD/JPY and the premature breakout of resistance level 115.677 shows that we could be seeing the rise of the bulls sooner than later
I would wait to see how the daily candlestick closes before making any conclusions. If the 115.677 resistance level breakout is confirmed, price next destination will most likely be 116.322.
If price closes with a strong bearish pin-bar, then price may return to support level 115.318.
2. EUR/USD
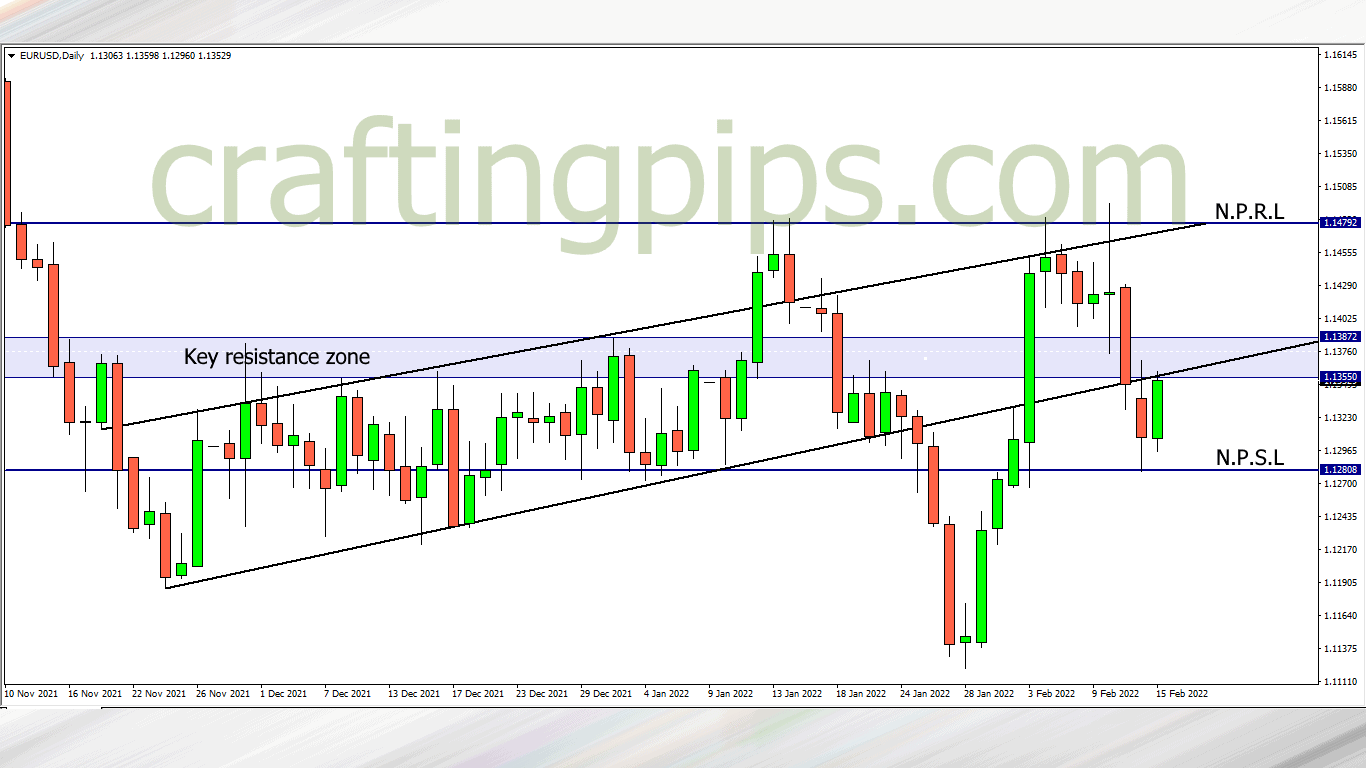
Towards the tail end of January we saw price breaking out of an ascending channel, but later reversed to re-visit resistance level 1.14792.
Price again got rejected by resistance level 1.14792, broke the base of the ascending channel, but we can now see that price is playing within the key resistance zone and support level 1.12808
If price daily candlestick does not break the key resistance zone, we could see price reversing back to support level 1.12808.
3. EUR/CHF
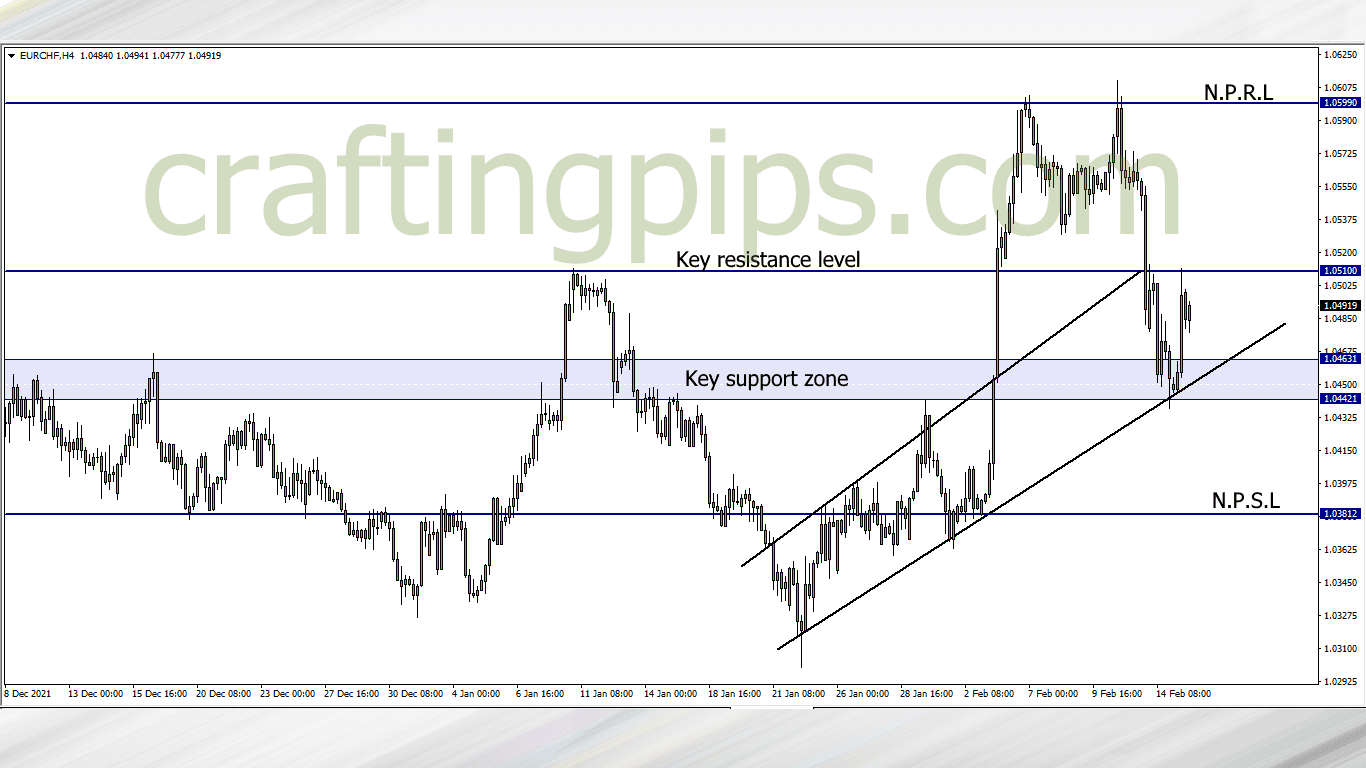
When comparing setups today, EUR/CHF is the opposite of EUR/CHF
If the daily candlestick closes above the 1.05100 key resistance level, then price may hit the next possible resistance level (1.05990)
If that fails to happen, then I will be waiting for the key support zone to get broken before selling the EUR/CHF, and having support level 1.03812 as our target profit
What say you?
Traders who are interested in joining our FREE trading group on Telegram, where trade ideas and trade-related topics are discussed, which could assist your trading career while being infected by positive vibes
hit us on Pip Crafters