Hello Traders,
Let’s quickly see what the charts have for us tomorrow.
1. USD/JPY

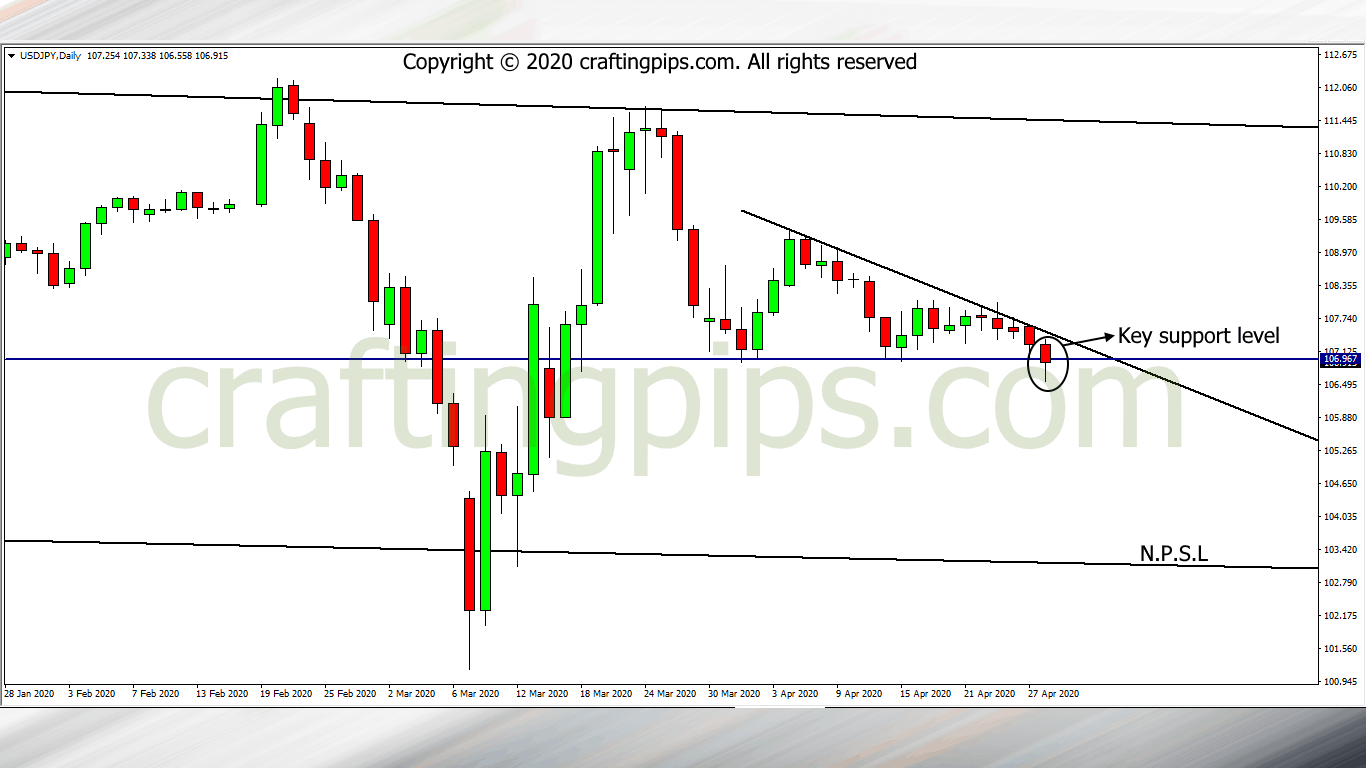
The USD/JPY is overall bearish, however, price on the daily chart has formed a triangle pattern, and if you observe closely, support level 106.967 could be the weakest of the support level.
If the close of the daily candlestick today confirms it, we may see sellers jump into the market and drive it further down to the next possible support level (103.060)
2. AUD/JPY

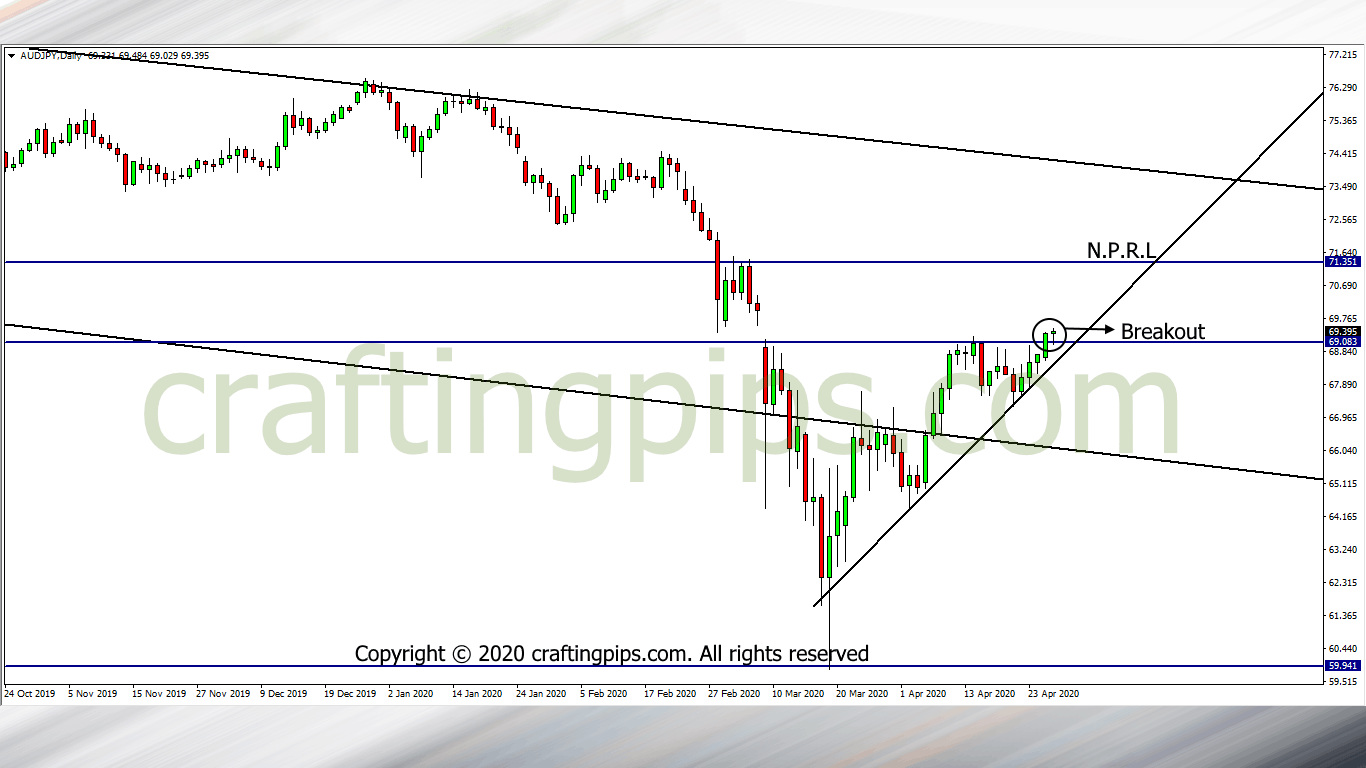
Though the AUD/JPY is locked within a descending channel when looking at it through the weekly time frame, we can see price slowly making new highs through the daily time frame.
This could also be referred to as a counter-trend trade. For those who have the balls to take such trades, once the daily candlestick closes bullish, we most likely would be looking at 71.351 as the next possible resistance level.
3. AUD/USD

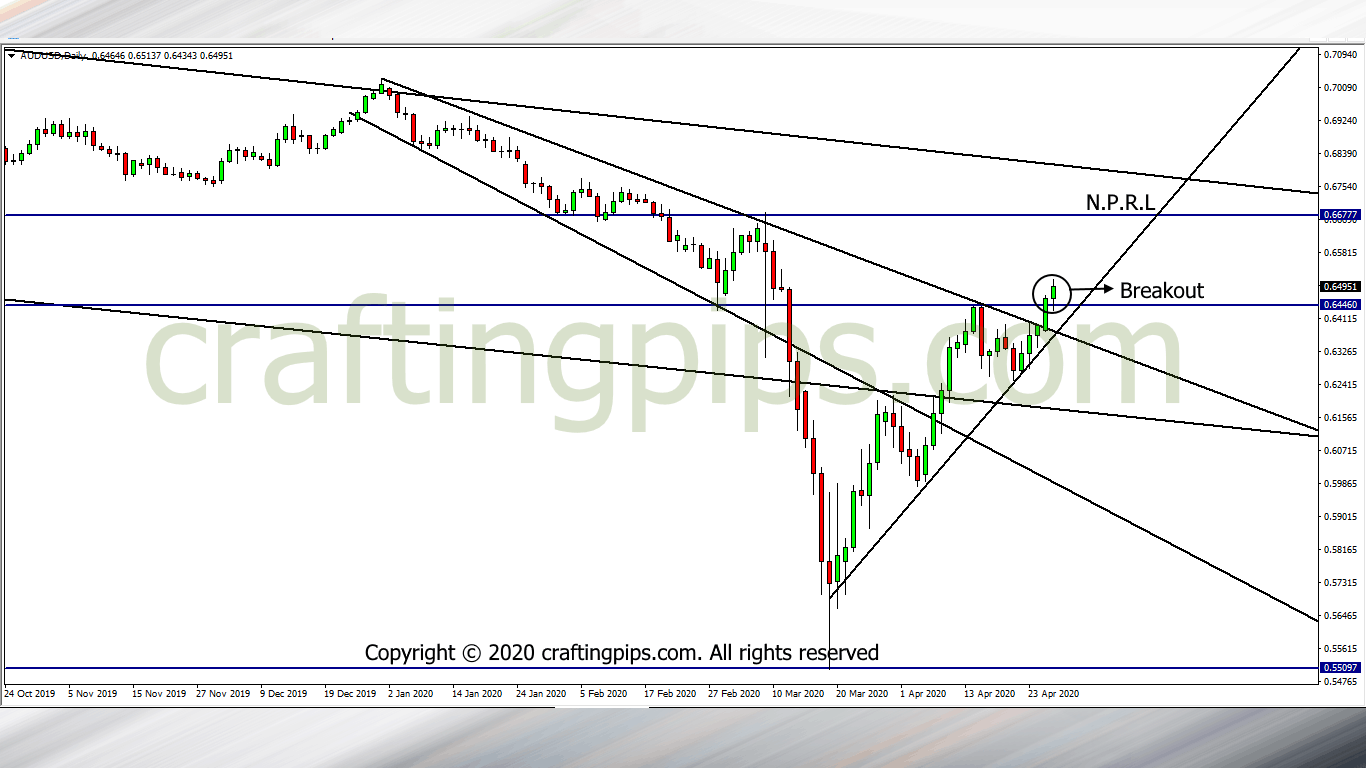
The AUD/USD and AUD/JPY share similar patterns and analysis.
All we need here is a confirmation of a buy, and if the close of the daily candlestick points towards a bullish direction, then we may be looking at 0.66777 as our next possible resistance level.
What are your views?