Good day traders,
Let’s hit the charts…
1. USD/CAD

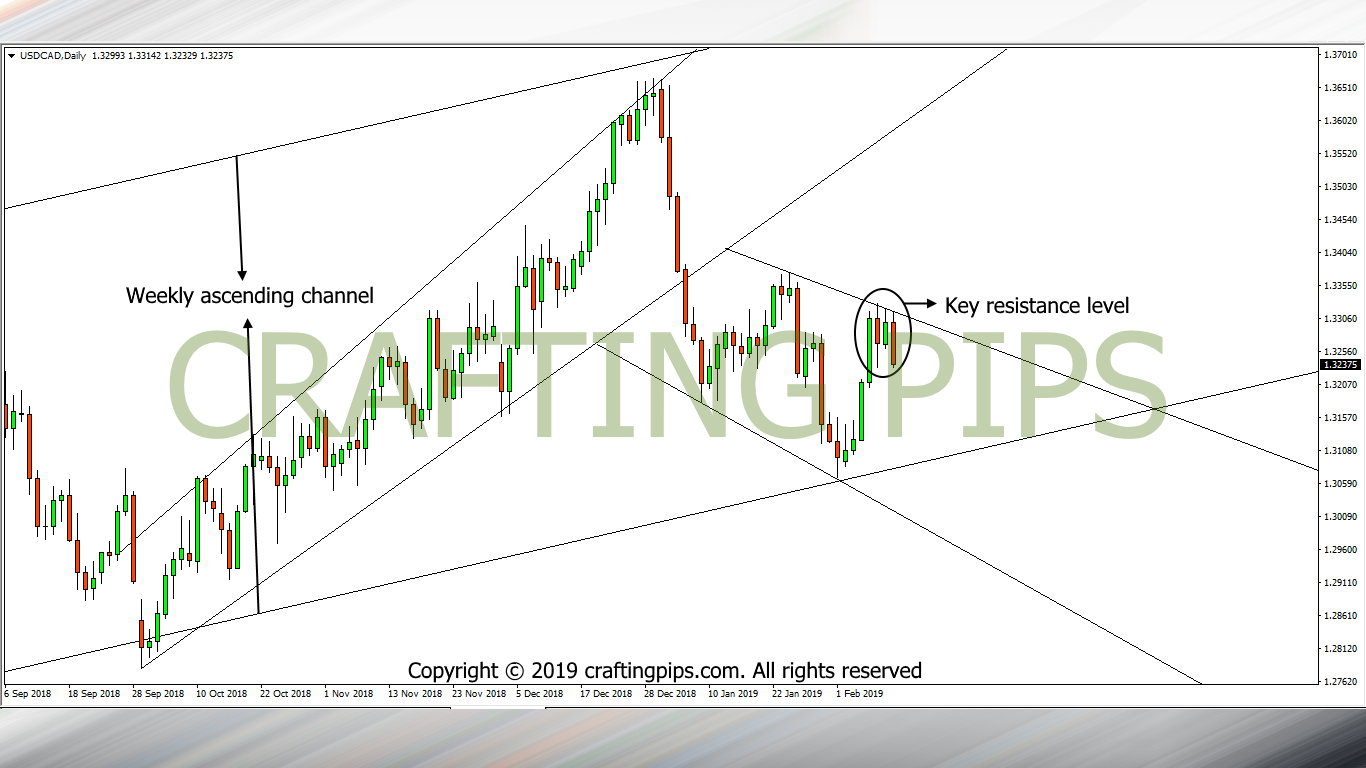
So much drama within the USD/CAD on the daily time frame.
This is one confusing setup and my reason for saying so is:
On the weekly chart, this pair is strongly bullish. The daily setup suggests otherwise, as price is locked within a descending channel.
This trade is a 50/50 trade. If the present candlestick closes this way, it would suggest that the bears have the strength to take price to the next support level (1.30891)
That said, for me, it’s safer standing by the sidelines.
2. AUD/JPY

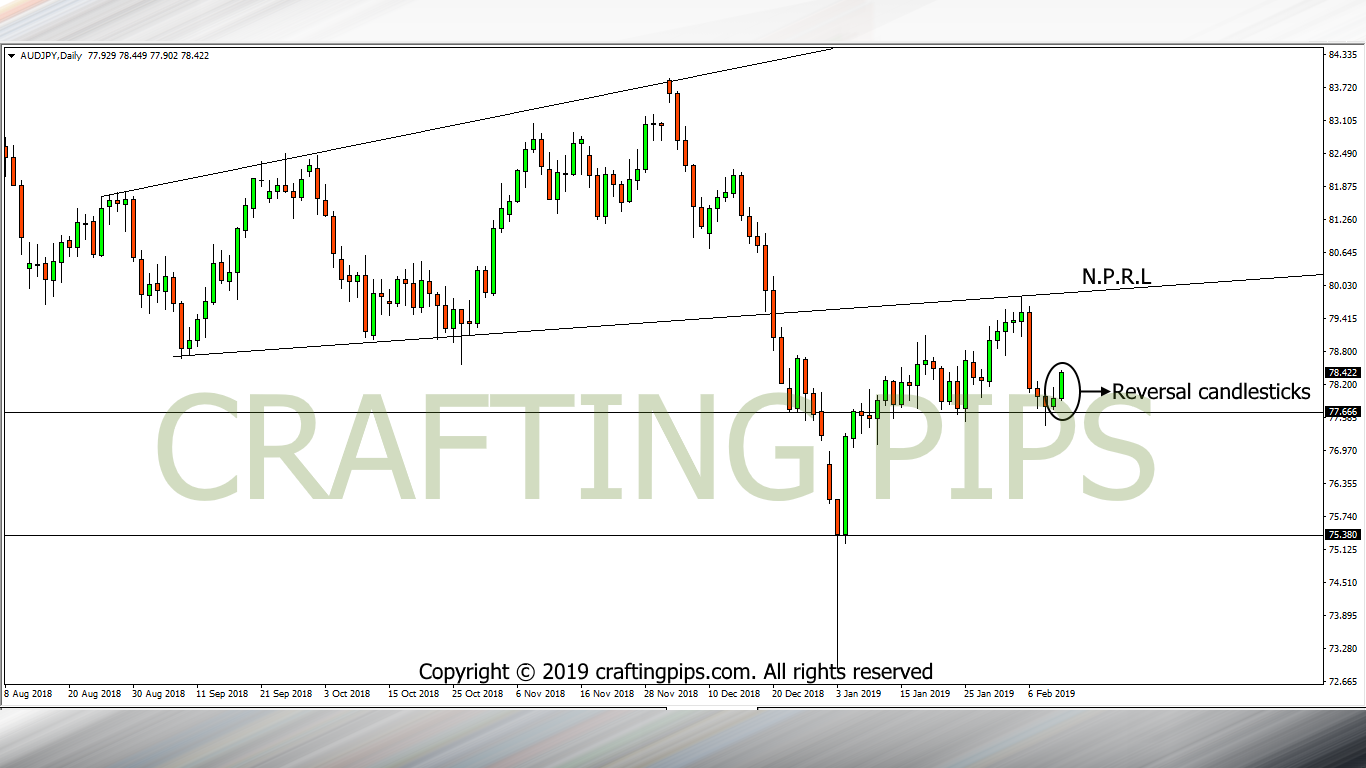
On the daily chart, AUD/JPY is ranging between a former breakout (79.494) from an ascending channel and a key support line (77.666) where price is presently resting on.
Today’s daily candlestick signifies a strong bullish setup. If today’s candlestick closes this way before the 11pm candlestick begins, we may most likely see the bulls take price to the next possible resistance level (79.857).
And with that, we come to the close of Wednesday analysis.
Do have a great day ahead