Hello traders,
let’s hit them charts:
1. GBP/JPY

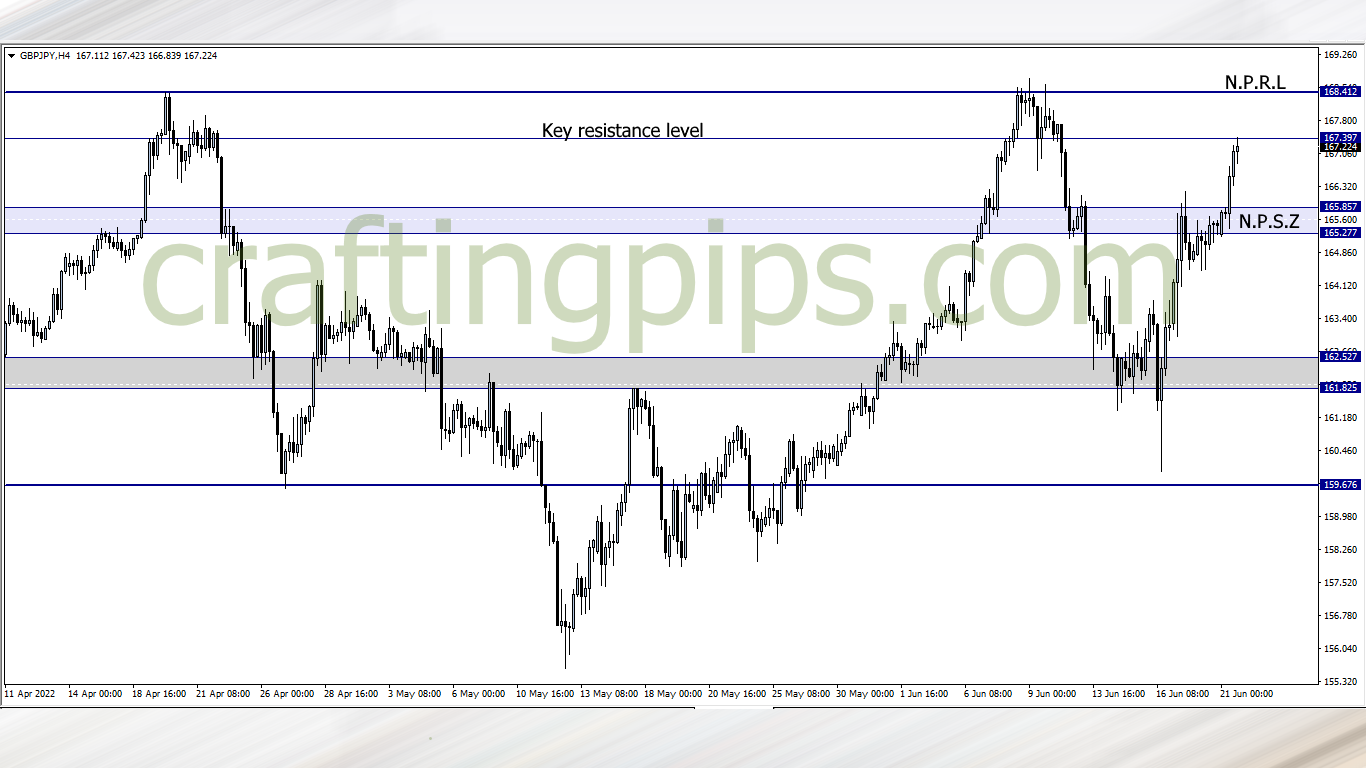
During the London session there was an aggressive bullish breakout by the GBP/JPY through a key resistance zone
Currently price is facing another resistance level (167.397). If price breaks through, then we may see price hit the next possible resistance level (168.412).
If the bears take over price at this point, then 166.160 will most likely be our next support level
2. EUR/JPY

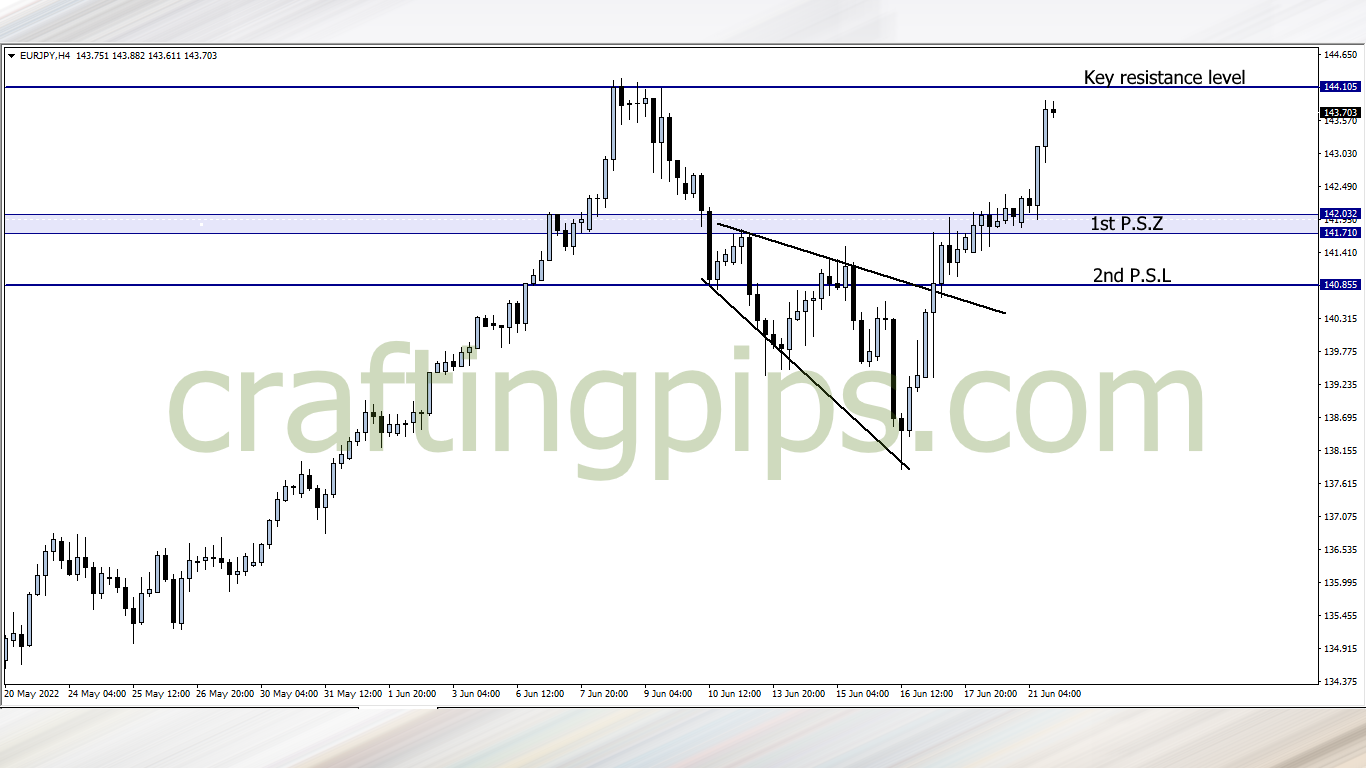
EUR/JPY is approaching a key resistance level (144.105)
Remember, the last time price broke this level was November 2014 (that’s about 7 years plus). If price succeeds in breaking this level again, we may see price spill another 130 pips plus as it makes its way to resistance level 145.672
While nursing a possible breakout, we should also be wary of a reversal at this point. If that happens, price could return to support level 142.032
3. USD/JPY

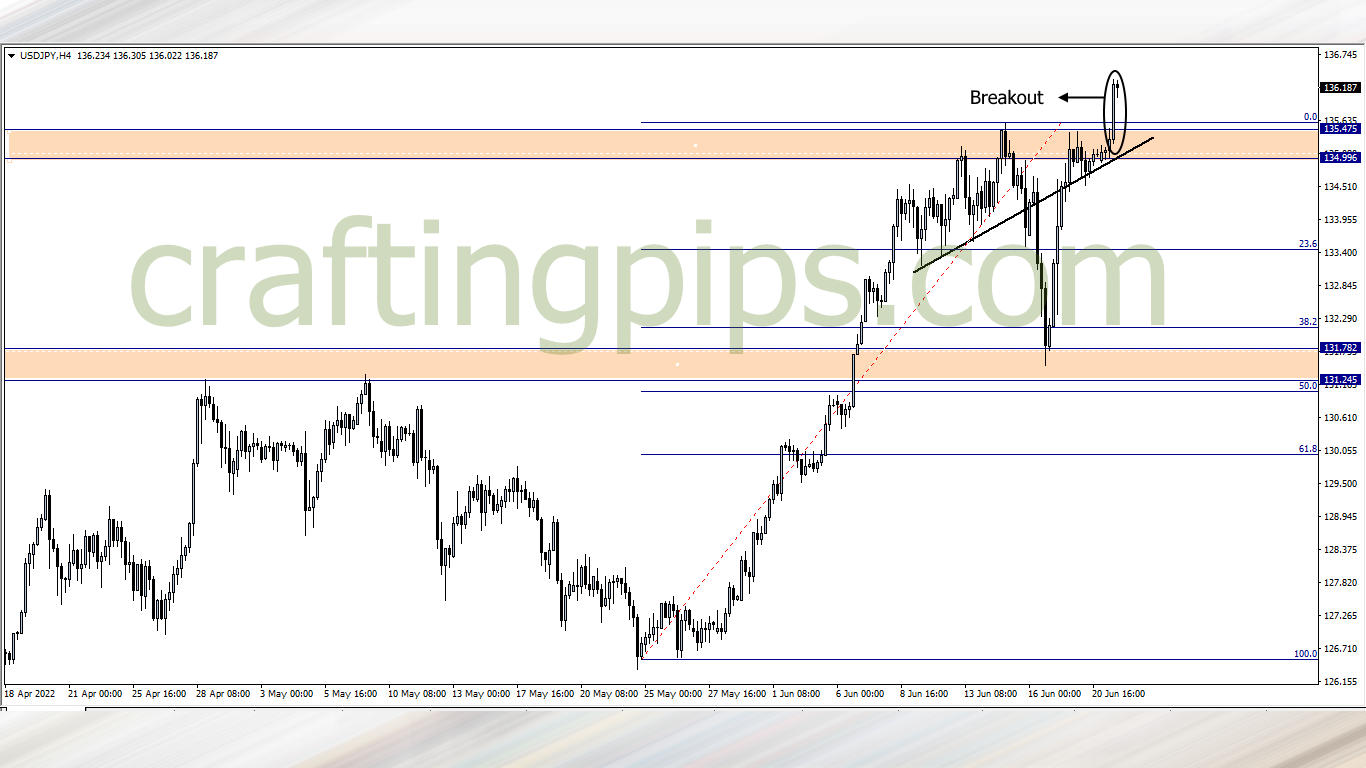
A reverse head and shoulders can be spotted on the USD/JPY.
The neck is an over 20 years old resistance zone. If the daily candlestick closes bullish, then this would be an opportunity to ride with the bulls to the next possible resistance level (139.943)
What say you?
Traders who are interested in joining our FREE trading group on Telegram, where trade ideas and trade-related topics are discussed, which could assist your trading career while being infected by positive vibes
hit us on Pip Crafters