Hello traders,
let’s hit the charts:
Today we saw huge volatility in the market after yesterday’s bank holiday’s in the U.S.
Due to this high volatility, some good setups are lined for our feeding pleasure. Let’s hit the charts.
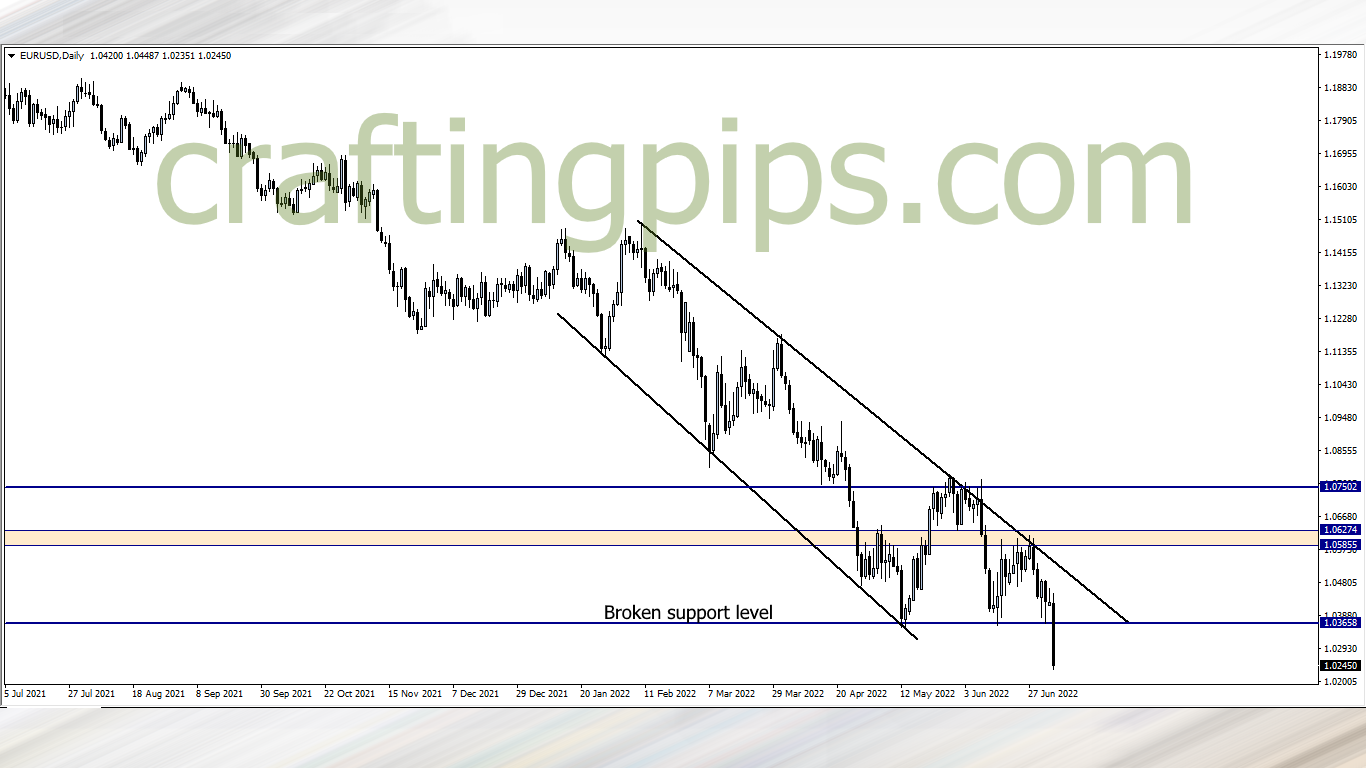
1. EUR/USD

Finally support level 1.03658 is broken. The support level that is broken is over 6 years old. If the daily candlestick closes this way, we may see EUR/USD continue to fall for the rest of the week.
We may see over 200 pips as price journey’s to the next possible support level (1.00090).
Mind you… We may see a deep pullback before price continues to fall.
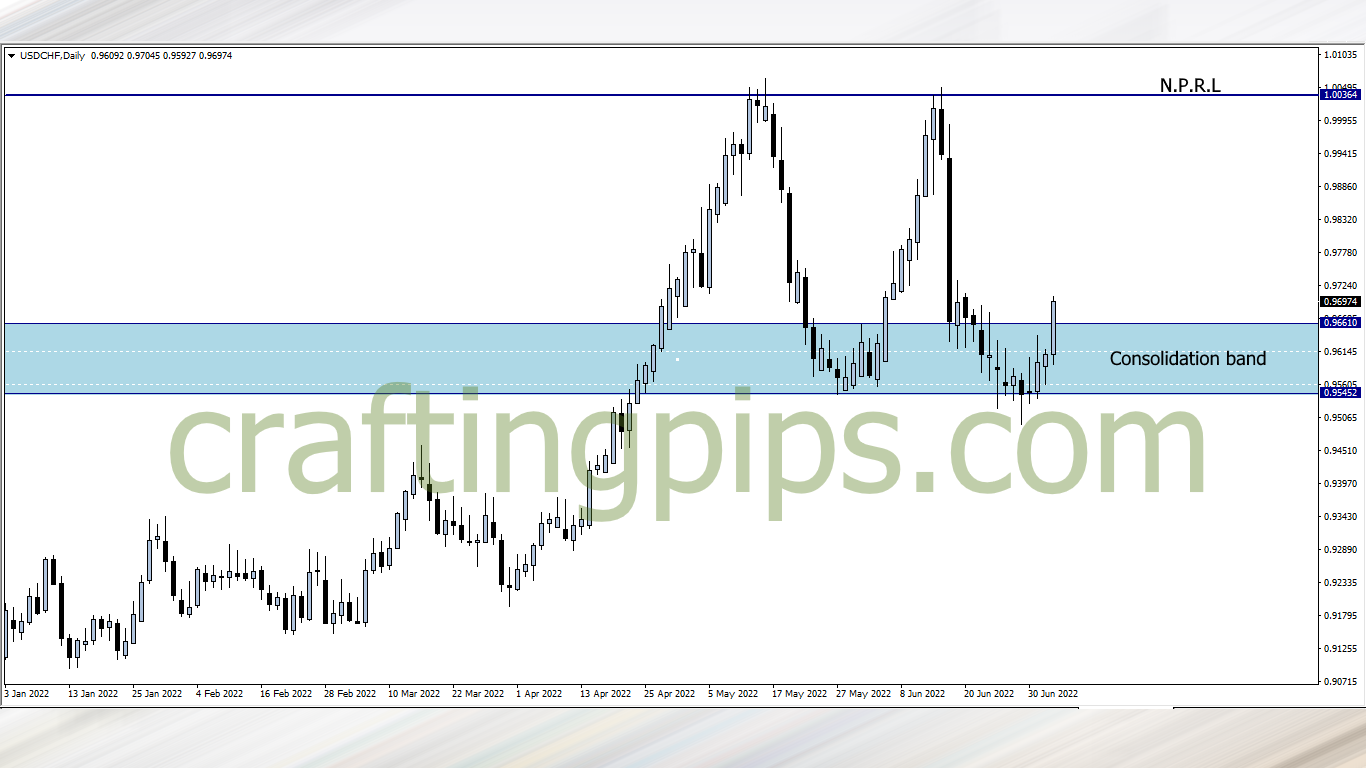
2. USD/CHF

USD/CHF has finally given us a reversal setup on the daily time frame.
Waiting for the daily candlestick to close, and if the candlestick closes bullish, we will look for buy opportunities, and ride to the next possible resistance level (1.00364)
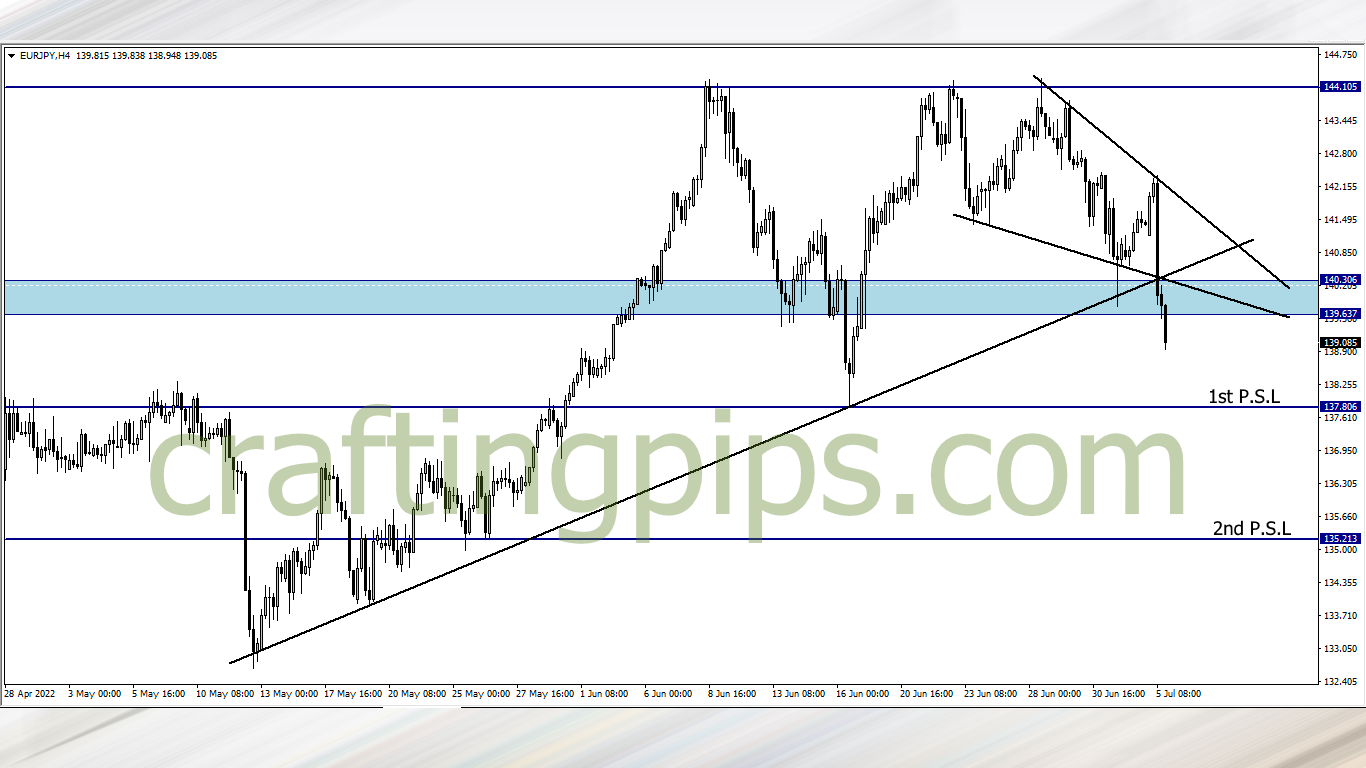
3. EUR/JPY

Ascending trendline is finally broken on the EUR/JPY.
If the daily candlestick supports the breakout, then we join the bears and ride price to the next possible support level (137.806).
If the bears continue dominating and break the 137.806 support level, then our next bus stop will most likely be 135.213
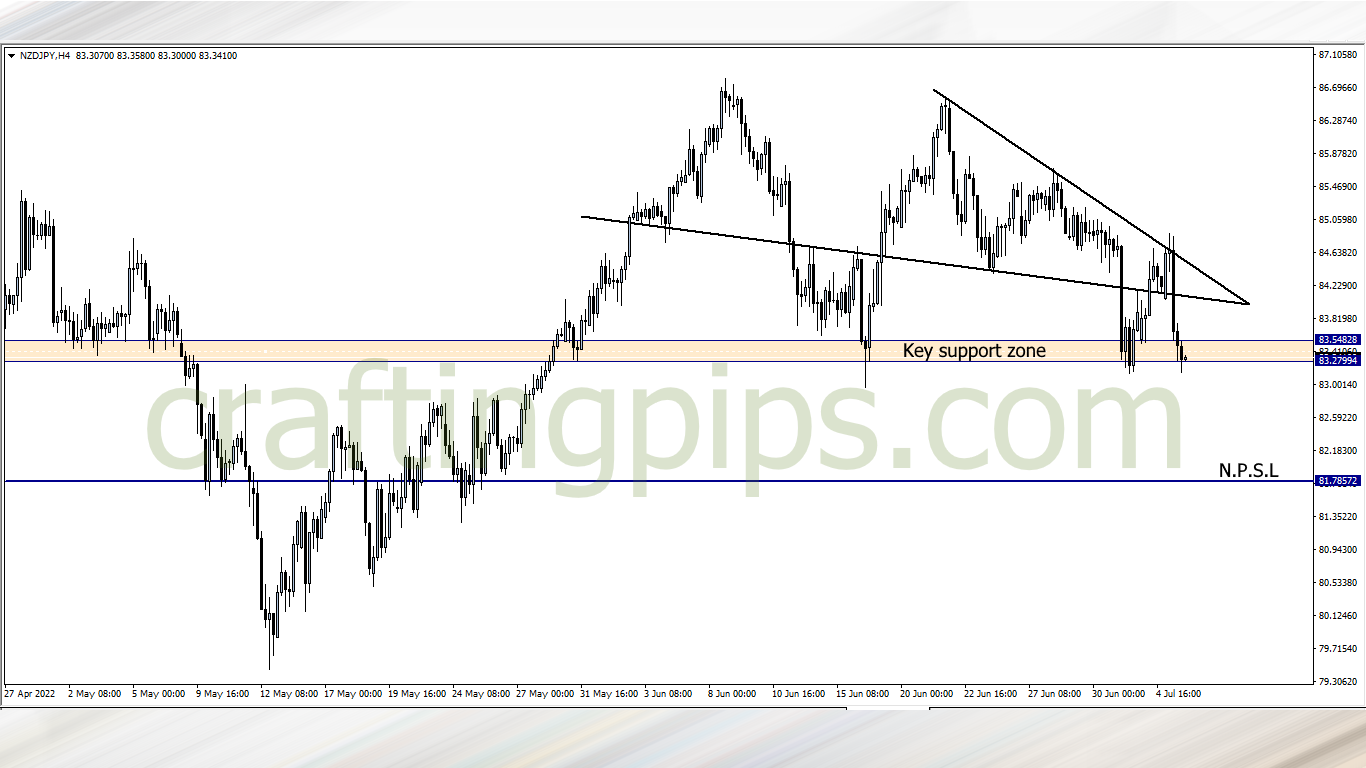
4. NZD/JPY

The key support zone is holding price by the whiskers.
If we do get a breakout, then price next destination will be support level 81.78572. If not, price will range between the key support zone and the base of the descending triangle.
I will be waiting for a breakout before I act.
What say you?
Traders who are interested in joining our FREE trading group on Telegram, where trade ideas and trade-related topics are discussed, which could assist your trading career while being infected by positive vibes
hit us on Pip Crafters