Hello Traders,
Let’s hit the charts…
1. AUD/USD

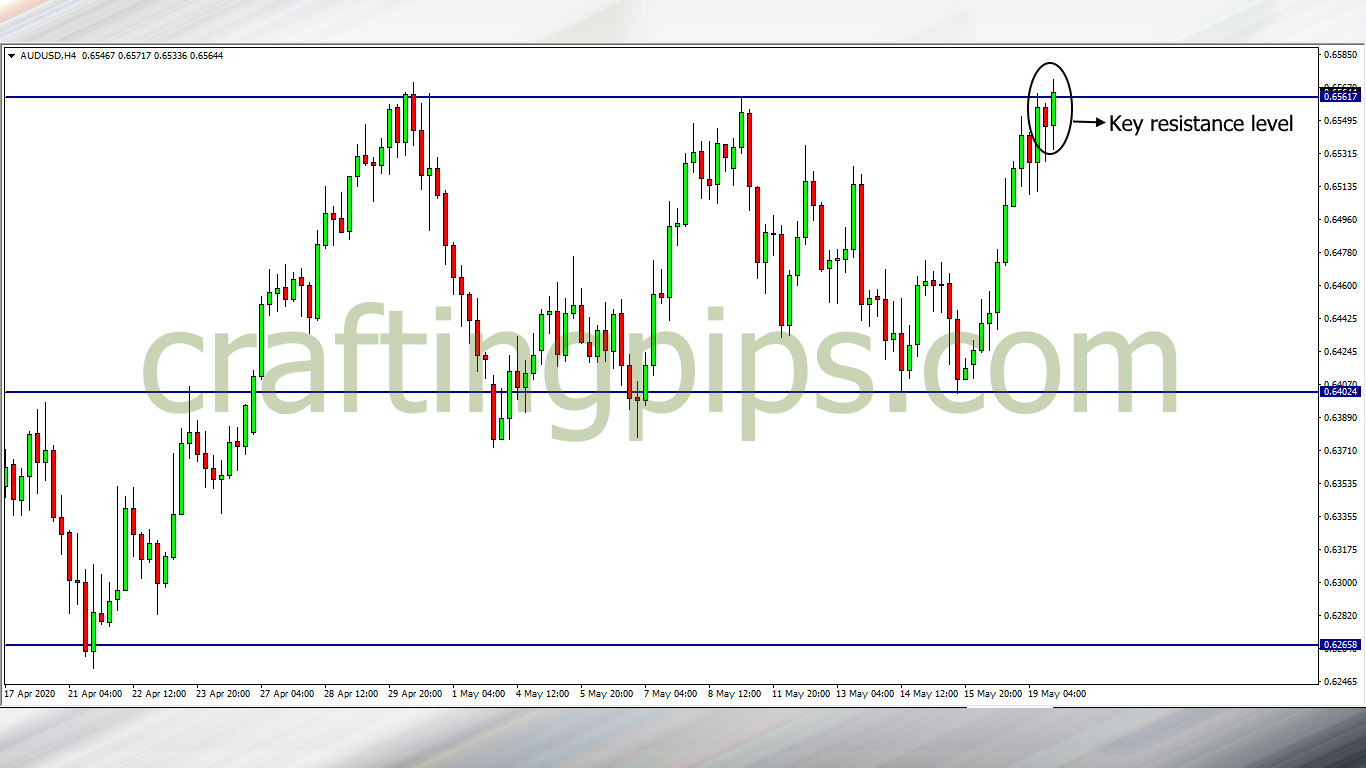
The AUD/USD started the week bullish after bouncing off support level 0.64024.
A breakout of the current resistance level (0.65617) on the daily chart could further encourage more buyers to drive price to our next possible resistance level 0.66777.
A reversal is also possible if the daily candlestick closes bearish or refuses to break the current resistance level.
2. GBP/CHF

On the daily chart, price on the GBP/CHF reversed before hitting support level 1.16813, this was discussed in our weekly analysis.
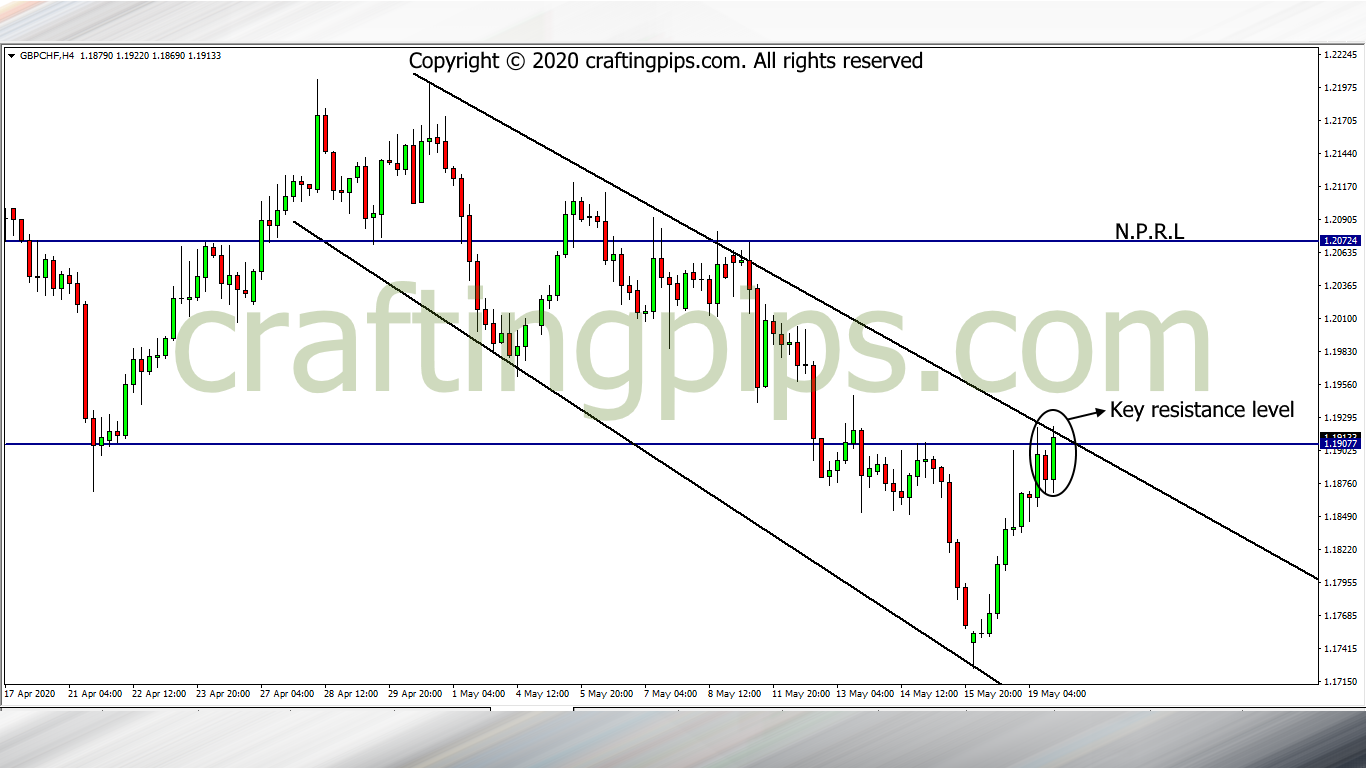
Presently on the 4 hours chart, we can see price struggling to break resistance level 1.19077. If the buyers are strong enough to break through, we could see price hit the next possible resistance level (1.20724).
If not, this may just be another pullback at the end of its course, and price may return to support level 1.17517.
The close of today’s daily candlestick may reveal to us price next move.
What are your thoughts?