Hello traders,
Let’s hit them charts:
1. GBP/JPY

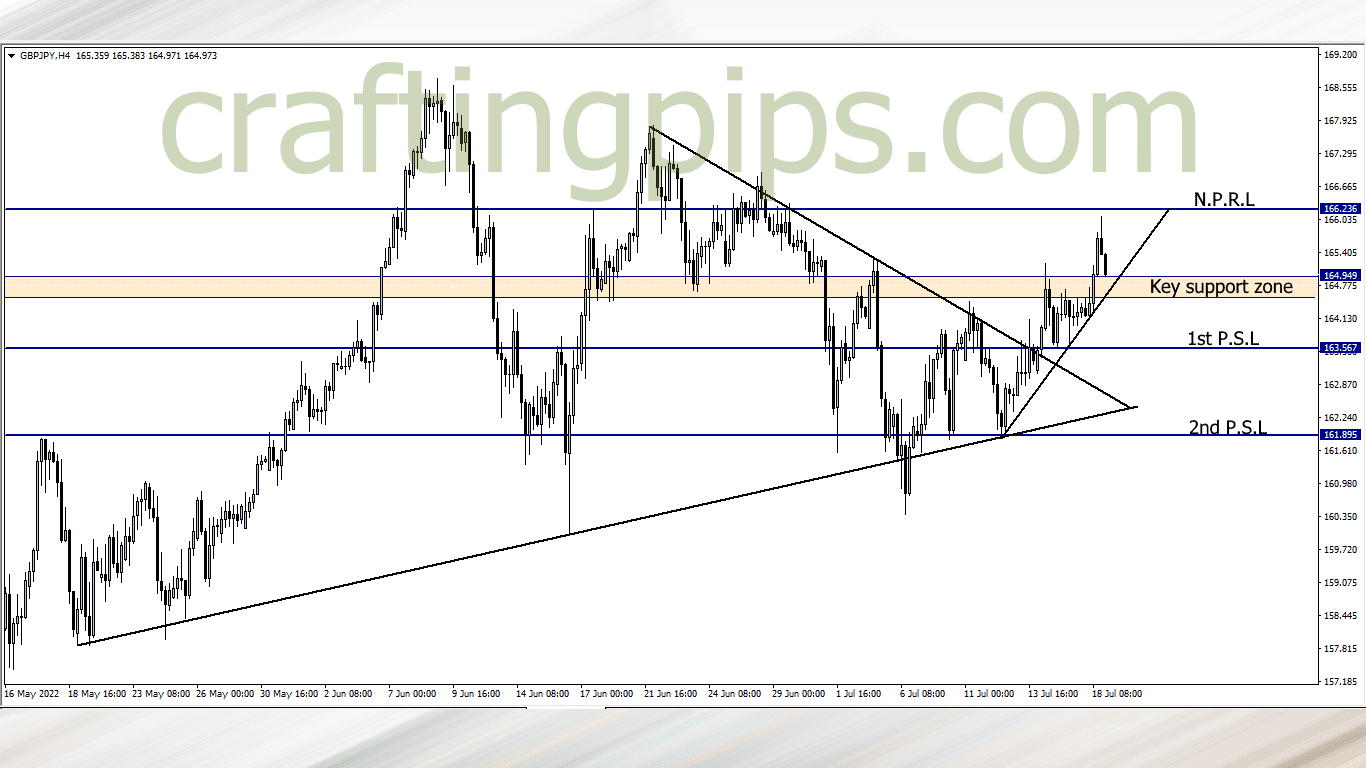
GBP/JPY bulls took a break after hitting resistance level 166.236.
The higher lows and higher highs price has formed over time shows us that the buyers are only just starting. The ascending trendline serving as a support level will most likely bounce price back to resistance level 166.236
However, If that fails, and price breaks below the key support zone, then we may see price first visit support level 163.567 before going further to hit the second support level (161.895)
This said, my bias is that price will most likely bounce after hitting the ascending trendline
2. CAD/JPY

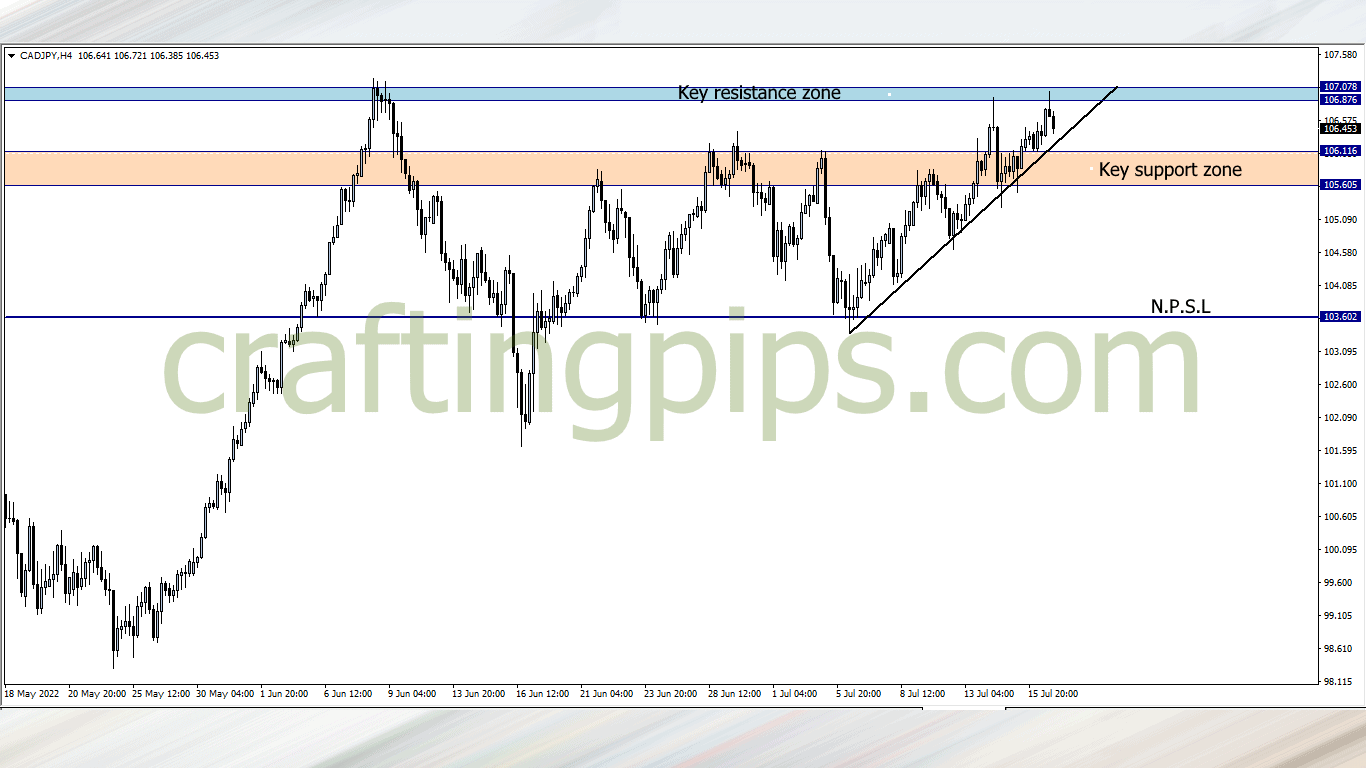
Price was rejected after hitting a 15 years old resistance zone.
Does this mean price has given up on breaking the legendary key resistance zone?
Not yet…
The ascending trendline serving as a support level needs to get broken first before this analysis becomes invalid. What we may see play out this week is:
Price may most likely return to the key resistance zone, break through it, and do over 700 pips in the next few weeks to come, or
Price may break the key support zone this week, and if that happens, the bears will take over and further drag price to the next possible support level (103.602)
What say you?
Traders who are interested in joining our FREE trading group on Telegram, where trade ideas and trade-related topics are discussed, which could assist your trading career while being infected by positive vibes
hit us on Pip Crafters