Hello Traders,
Let’s hit the charts…
1. NZD/JPY

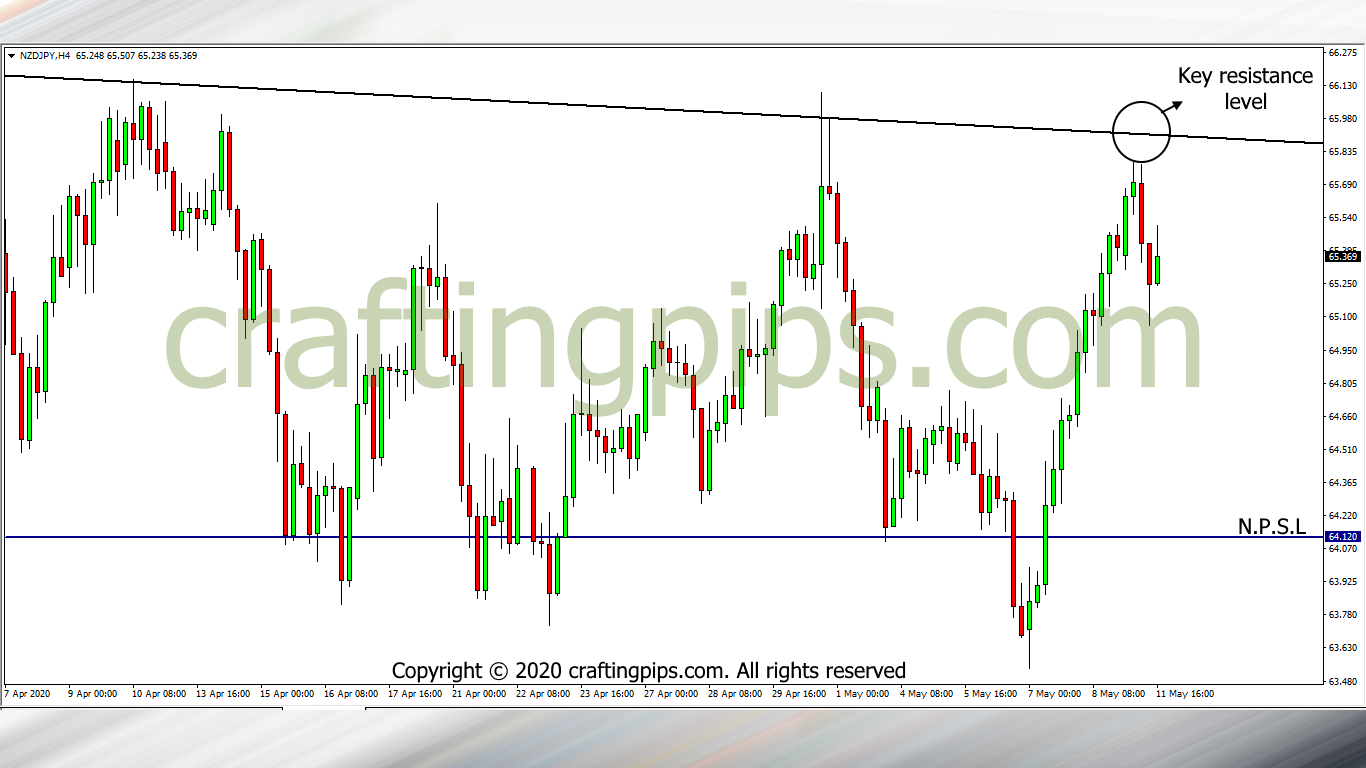
On the daily chart of the NZD/JPY we can see price trying to hit resistance level 65.910 for the fourth time.
On the 4 hours time frame we can already see a reversal.
For the more conservative traders, waiting for the close of the daily candlestick may further help us to ascertain price direction.
2. CAD/JPY

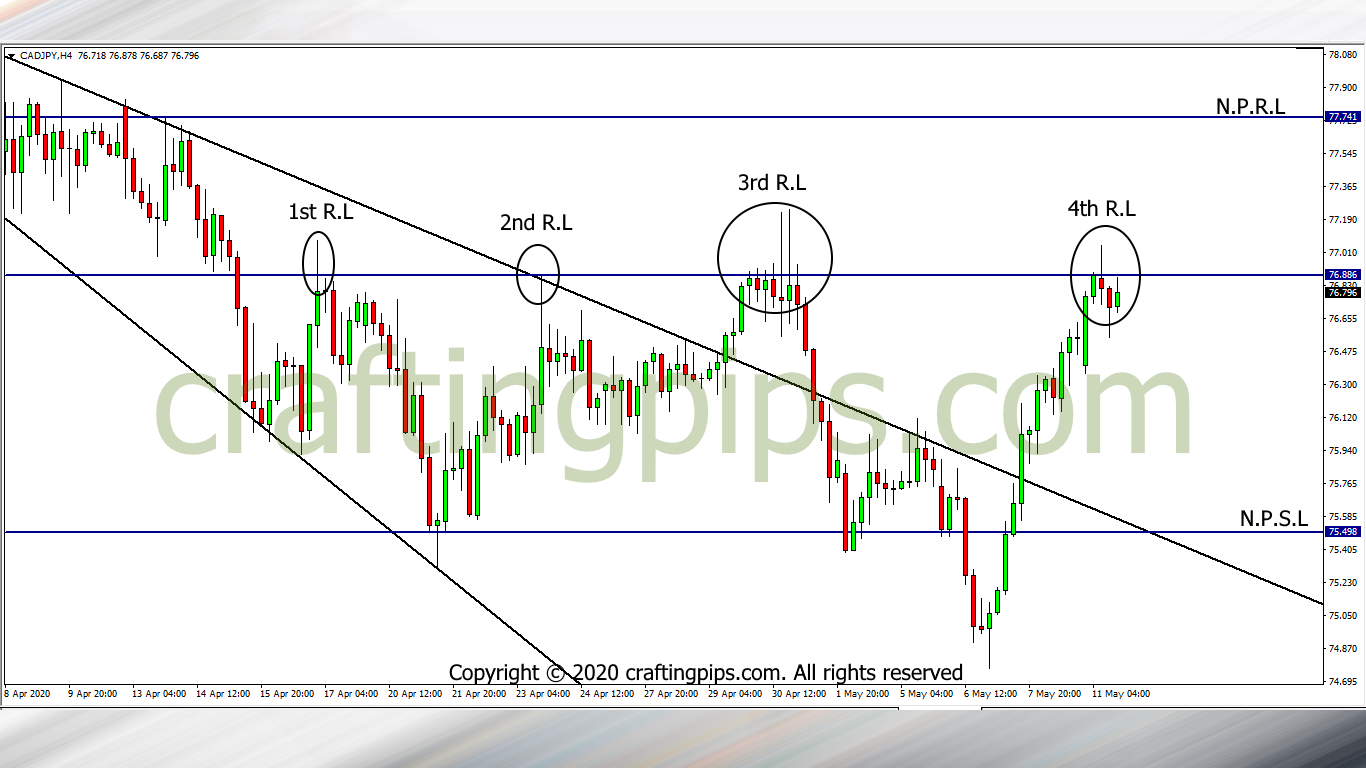
Price on the CAD/JPY is currently struggling with resistance level 76.886.
Remember this is the 4th time price is hitting this level and the resistance level may MOST LIKELY be weak.
A breakout of the current resistance level will most likely encourage buyers to push price to the next possible resistance level (77.741)
Though my bias is bearish, I most also say we thread with caution if selling this pair.
What are your thoughts?