Good day Traders,
Welcome to the first Tuesday of the month of February. Let’s hit the charts and see what’s happening.
1. NZD/JPY

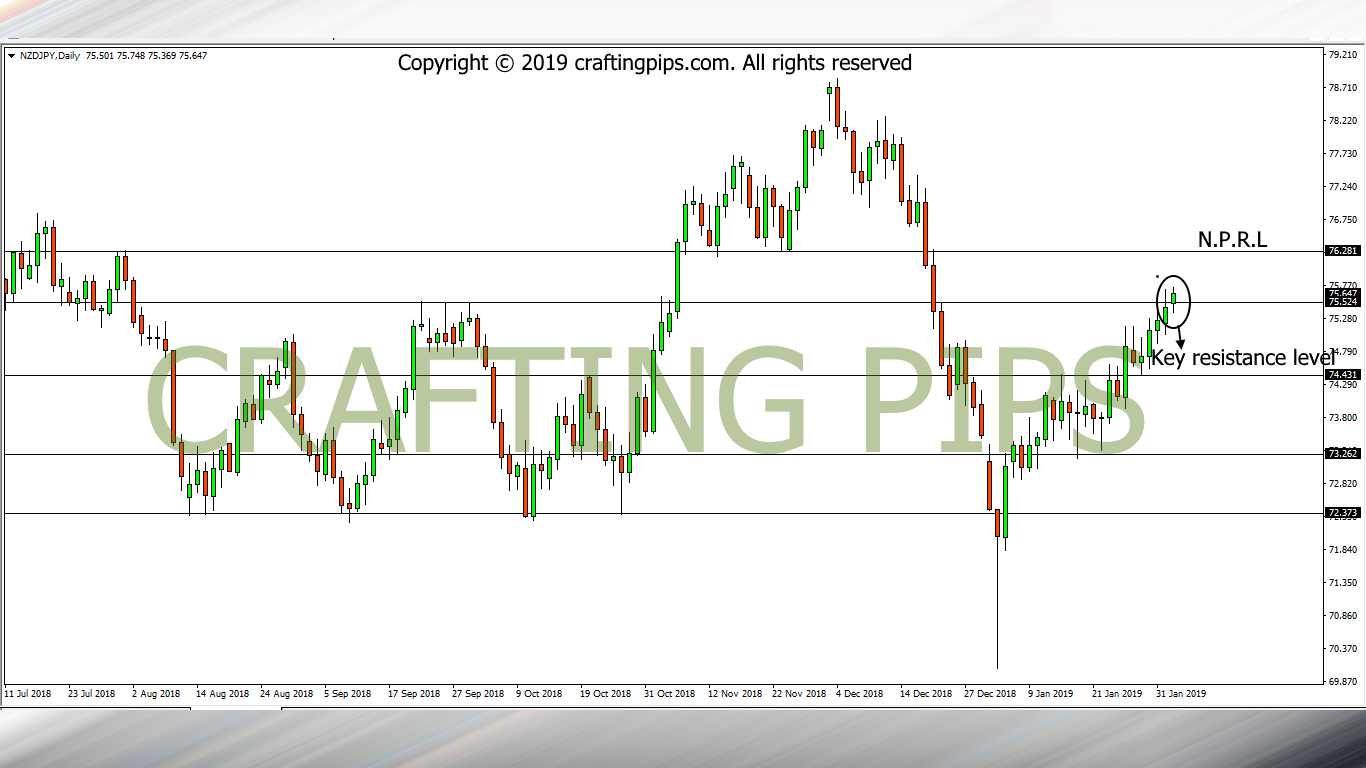
NZD/JPY on the daily time frame, currently has price struggling around the resistance level (75.524).
If the daily candlestick closes above the resistance level (75.524), forming a Marubozu, the bulls may most likely be warming up to take price to the next possible resistance level (76.281) as soon as the 11 P.M candlestick appears.
However, if price doesn’t break the present resistance level (75.524), we may have to stay off this trade, except the daily candlestick closes with a bearish pin-bar, then we should be hunting for SELL opportunities, having in mind that next possible support level would be 74.431.
2. CAD/CHF

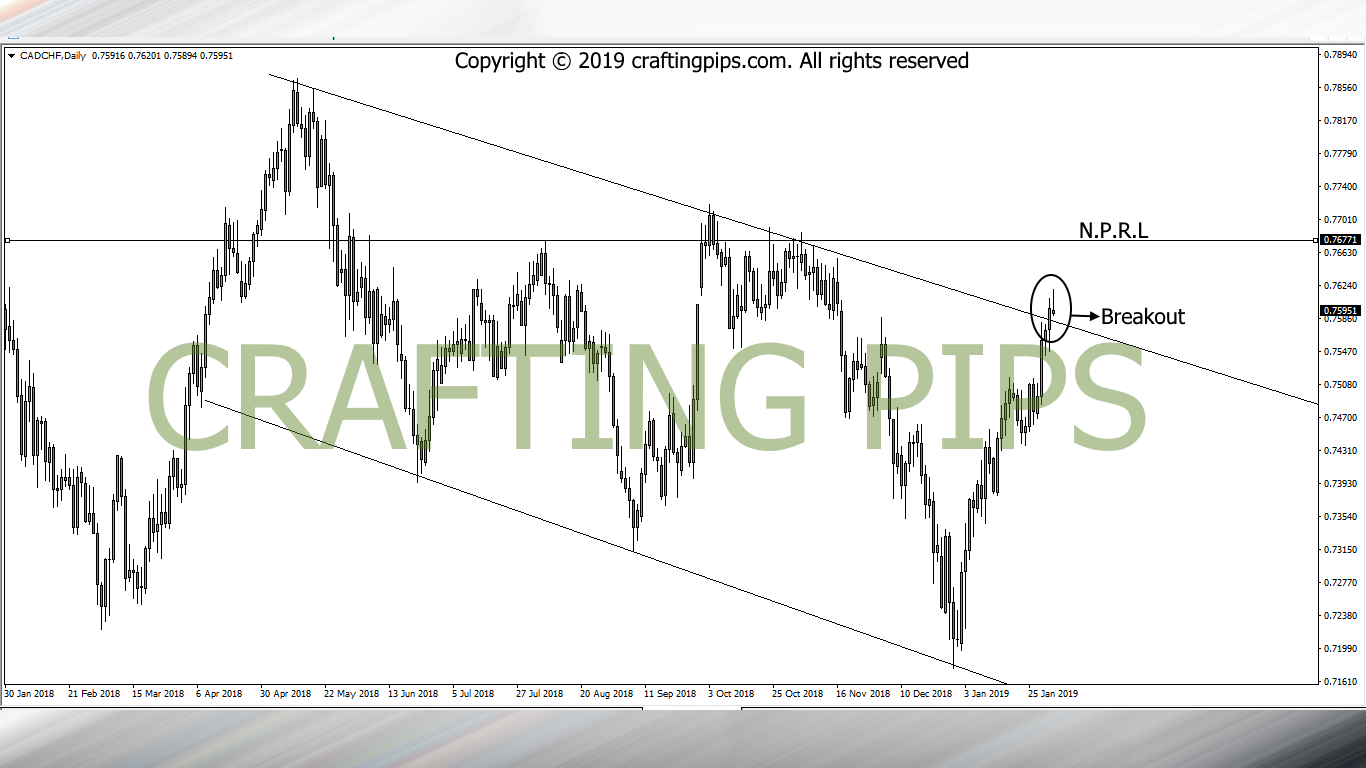
On the daily chart, CAD/CHF has price locked within a descending channel.
There was a bullish breakout from resistance level 0.75826 on Friday, and price observed a pullback for the better part of today.
My bias on CAD/CHF is that:
The bullish journey of price may most likely continue as soon as the 11 P.M candlestick hits the charts. Then, the next possible resistance level for CAD/CHF would be 0.76771.
Remember, this is a daily chart, and there is great tendency that our analysis may most likely play out before the end of the trading week.
That said, do have a great trading day ahead.