
In my early years when I still struggled to learn how to trade breakouts properly, there were some breakouts I would trade, but later discover that I either bought or sold too late or too early.
Well, breakouts were some of those key setups that always set me up when they occurred.
This pissed me off for years. I mean, I kept losing money to the market, not necessarily because I was wrong all the time, but the fact that I could not properly harness breakouts whenever they emerged.
After a while I began to notice that some breakouts repeated a clear pattern more often, when you look over a period of time.
My new discovery fostered the development of a few bag of tricks which helped me harness those setups whenever they occurred.
So, you are reading intently and asking impatiently: “what trick are you talking about?, spit it out buddy”
Alright let’s get down to business.
Have you ever heard or read a popular cliché among traders that goes thus:
After a breakout, its paramount to wait for a confirmation, before following the trend.
Well,
I cannot entirely flaw this statement, however, in some cases, its not entirely true.
That said, there is a way of making a quick buck when some breakouts do occur, the trick is being able to balance two key ingredients, which are:
- Properly examining the closing candlestick immediately after a breakout
- Managing the active trade you took within a particular trading session.
Before we go any further, I would love to do a little classification of the candlesticks, based on the SIZE of their REAL BODY as against the size of their wick.
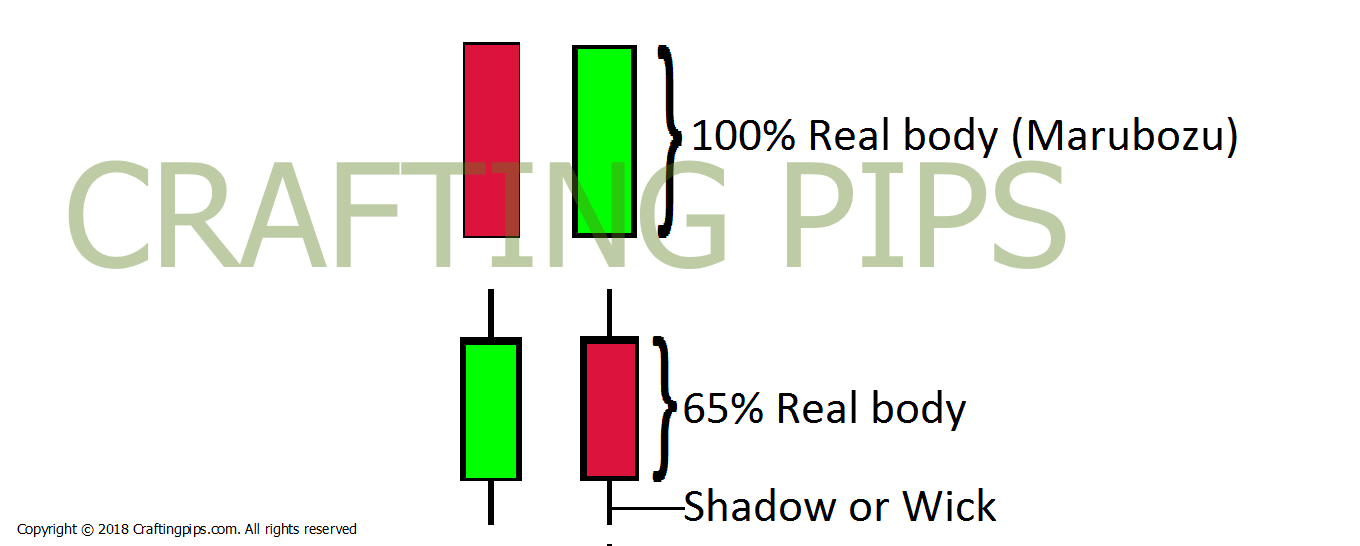
Let’s begin by focusing on the size of the REAL BODY on a candlestick formation.
Each of the candlesticks above signify a bullish or bearish movement when they occur in a trend.
The Marubozu signifies a greater bullish or bearish trend when compared to the 65% real body candlestick.
I can see you wondering how I got the 65% real body candlestick formation…
Don’t be bothered about it, its just an assumption made specifically for this explanation.
The 65% candlestick formation is gotten from the size of the REAL BODY as against the size of the wick or shadow formed.
What I want you to grasp from all these technical mumbo jumbo I am trying to explain is:
The lesser the percentage of the REAL BODY formed across a support/resistance breakout, the higher the conflict between the buyers and the sellers.
The higher the percentage of the REAL BODY formed across a support/resistance breakout, the lesser the conflict between the buyers and the sellers (This kind of breakouts is what facilitates good bullish or bearish breakouts)
In a breakout what we watch-out for is:
- How much of the candlestick’ REAL BODY breaks out of the support or resistance and
- The holding time of that trade within a trading session.
So, lets take a few examples to illustrate what I am whining about.
-
How much of the candlestick’s REAL BODY breaks out of the support or resistance
As a day trader, if you wait for the close of the NEW YORK session (10.00 PM GMT).
and you notice a 100% REAL BODY breakout or what I refer to a Marubozu breakout, there is no point waiting for a confirmation or a correction to be made before joining the trend.
If you check the chart below, you would notice that breakouts with a fuller body, rarely forms any correction, they just blast through a support or resistance once there is a breakout.

The major thing you need to watch out for is the size of the real body in a candlestick that crosses over the breakout.
NOTE: It does not necessarily have to be a Marubozu.
This could be illustrated in the next breakouts in the chart below

Even a 60% bullish breakout with over half of its REAL BODY across a breakout is potent.
As an intraday trader while using the 4 hours chart, if the 6 am GMT candlestick closes appropriately across a breakout.
You can take a position prior to the opening of the UK session (8 am GMT).

So, we are done with the first factor to consider when thinking of how to make a quick buck during a breakout, which is:
watching out for is the size of the REAL BODY that crosses over a support or resistance.
Lets talk about the second factor, which is:
2. The holding time of a trade within a trading session
As an intra-day trader, you need to be very conscious of time when pulling off such a trick.
Personally, 90% of my intra-day trades are on the UK session, . If I take a breakout trade from a 4 hours chart at about 6am GMT, shortly before the UK session, I will ensure that trade is closed before 1 pm.
You ask why?
My reason is, if you do not exit that breakout before the New york session commences, there is a great tendency for reversals, and we don’t want that.
If at all you are planning to leave the trade halfway through the New york session, always shift your stop loss to break-even.
Applying holding time to the daily time frame when executing breakouts
The same technique applies to taking breakout trades from the daily time frame.
I take breakouts from the daily time frame whenever they occur at the close of the 10 pm candlestick, which coincides with the close of the New york session (10 pm GMT).
Currency pairs that have a higher degree of obeying the daily breakouts at the end of the New york session are a few of the JPY pairs (aud/jpy and nzd/jpy,).
NOTE:
After taking such a breakout, from the daily time frame, there is a high tendency for the liquidity to drop shortly before the UK session (8 am GMT) resumes.
Holding time should not exceed the Asian session(11 am to 8 am GMT), and if it does, you have to move your stop loss to break-even, just in case the inevitable happens.
Another factor that should be considered before pulling off such a trick is:
- Do not, take such trades on Sunday’s 10 pm GMT, when the market is just opening. There is a higher probability of such trades failing. Same applies to trading breakouts on Monday’s during the UK session.
- Do not also apply this method on both trading session during Friday’s, there is a high probability that the market won’t favor you.
In Conclusion:
In trading forex, nothing is absolute.
Meaning, there is no technique or indicator that works 100% of the time, its the reason why it is paramount to learn how to work on probabilities alongside applying great money management techniques.
That said, let me know if this piece helped or if you have contrary views.
![]()
![]()
![]()
![]()
![]()
![]()