Hello traders,
we are heading into the last trading day of the week. Let’s see what pairs we should be looking at and pairs we should be wary of:
1. GBP/USD
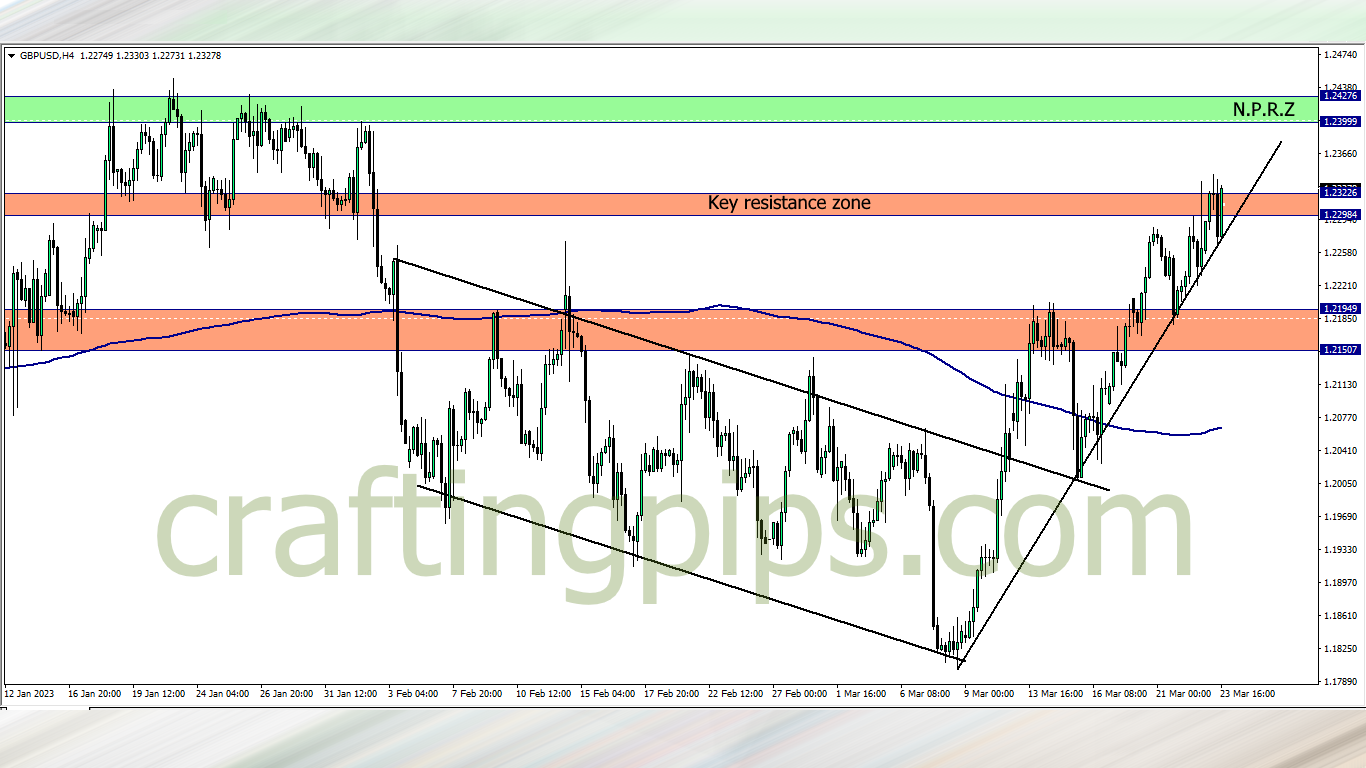
The key resistance zone was one though nut to crack on the GBP/USD, even after the FOMC news.
We can now see from the 4 hour time frame that the bulls have managed to bounce off the ascending trendline that serves as a support level for price. This means that there is renewed bullish momentum, and there is a huge probability that price next bus stop will most likely be the green zone.
The tricky aspect about this setup is: We may see price lose steam as we get deep into the NY session since London session will be off. GBP/USD is a setup that historically does not do well MOST TIMES during these session, so be cautious
2. USD/JPY
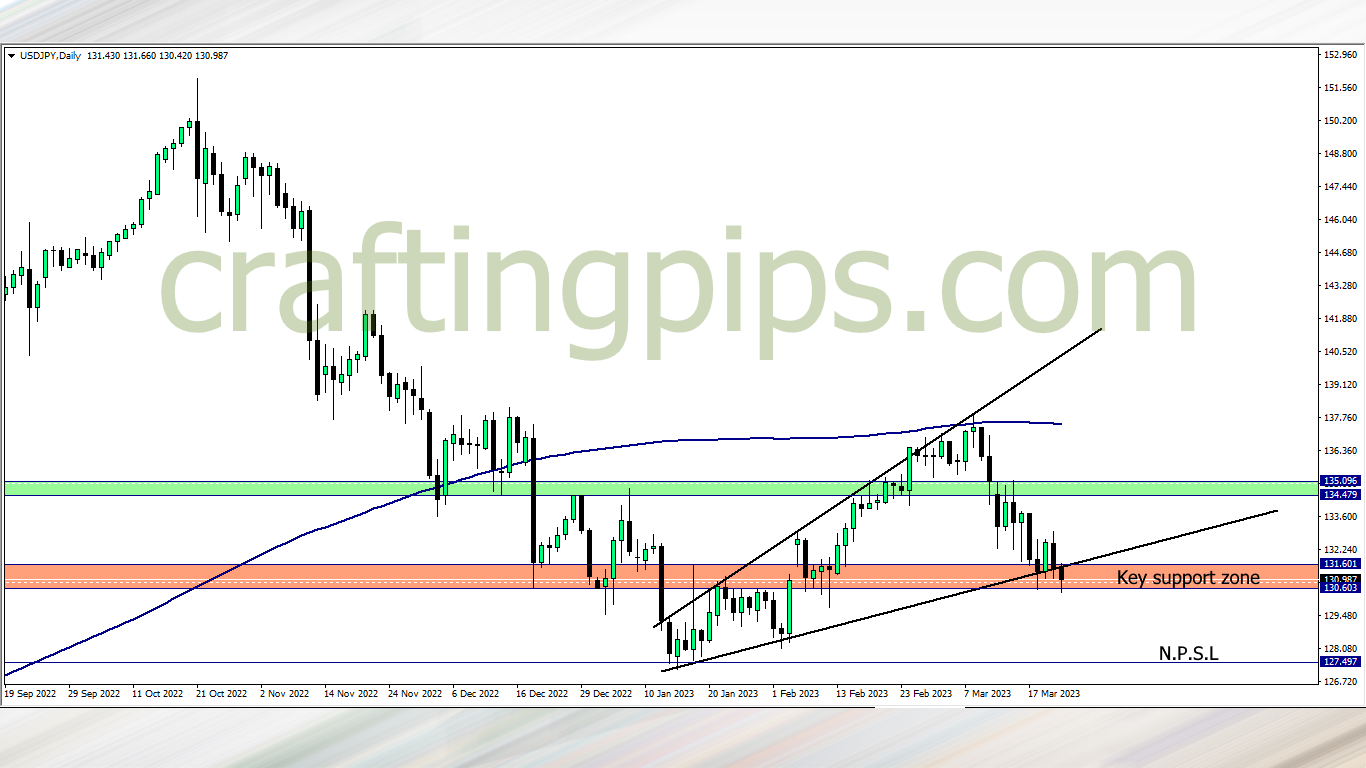
The USD/JPY has a tricky setup.
The fact that the Tuesday bullish engulfing candlestick failed to encourage buyers drive price up North, I am in serious doubt that buyers still got what it takes to take price back up.
Selling as it is is also very risky because price has still not broken the key support zone. If we are lucky and that happens at the close of the Thursday daily candlestick, then we are free to join the sellers to the NPSL. If not, standing by the sidelines won’t be a bad idea
3. NZD/USD
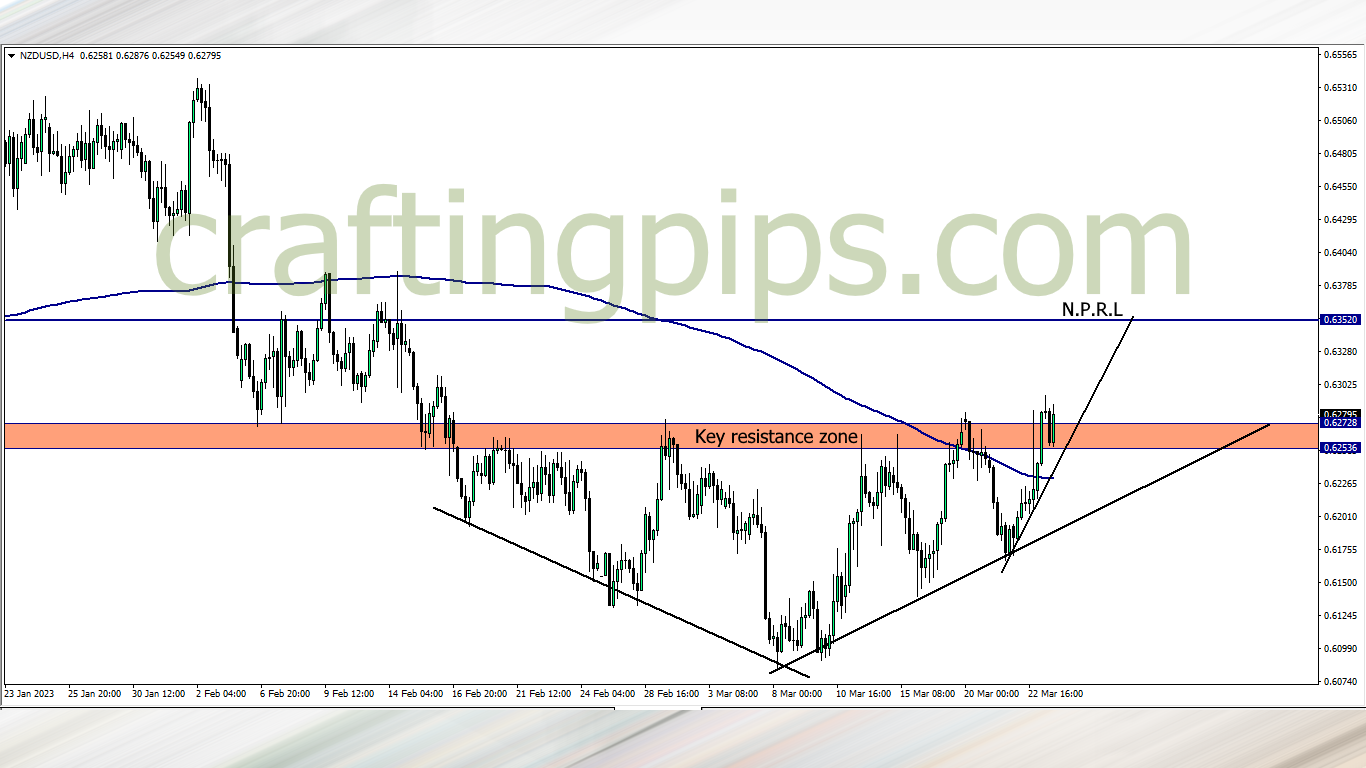
If you were to take any trade between last NY session and the beginning of the London session, it would be the NZD/USD.
Why you ask?
There is no high impact news till 2.45 pm tomorrow. So we have ample time to plan our move against this bad boy.. First of, the resistance zone has been tested over 4 times. This makes the resistance zone weak. Secondly we have the 200 ma right below price, hence giving buyers a go-ahead to mess up the sellers
Lastly we can see the steep higher lows and higher highs compromising the resistance zone. Waiting for the close of the daily candlestick to authenticate our bias will not be a bad idea.
4. EUR/CHF
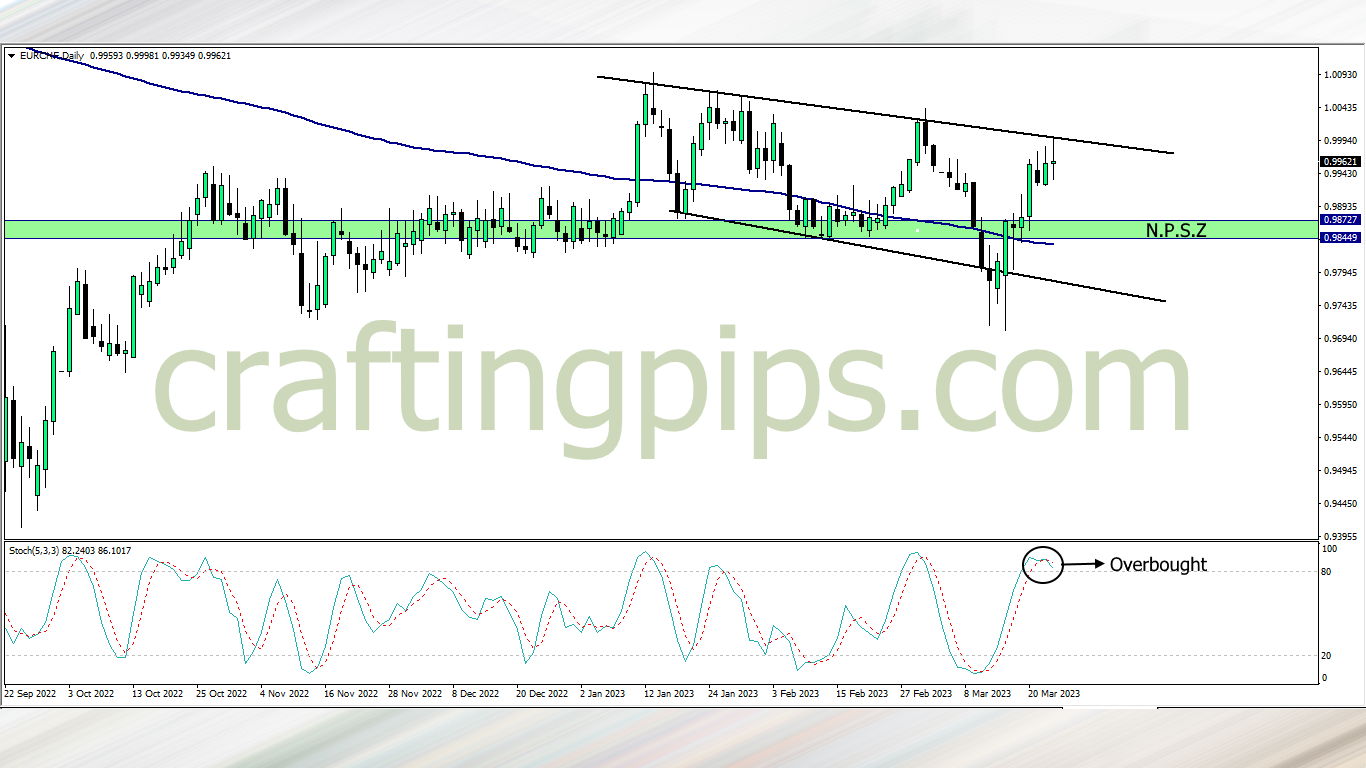
The EUR/CHF is one setup I would so love to milk. It has a perfect rejection at a key resistance level, the stochastic indicator also shows its overbought, and the 200 ma shows us exactly where to place our target profits, but there is one drawback.
Starting from 9.15 am, Friday is riddled with high impact news on the Euro. This means that if price does not make any significant move through the NY and Asian session, we may suffer a loss selling this pair.
What say you?
-
FIDELCREST: https://fidelcrest.com/#CRAFTER
-
THE FUNDED TRADER: https://dashboard.thefundedtraderprogram.com/purchasechallenge-n/?sl=3322 (use the coupon code: THE0CRAFTER)
-
MY FUNDED FX: https://myfundedfx.com/#a_aid=THE_CRAFTER