Hello traders,
today’s pairs is what I will call the yin yang pairs. Both move in opposite direction for the most part, and today we can see the same most likely going to happen based on their setup
1. GBP/USD
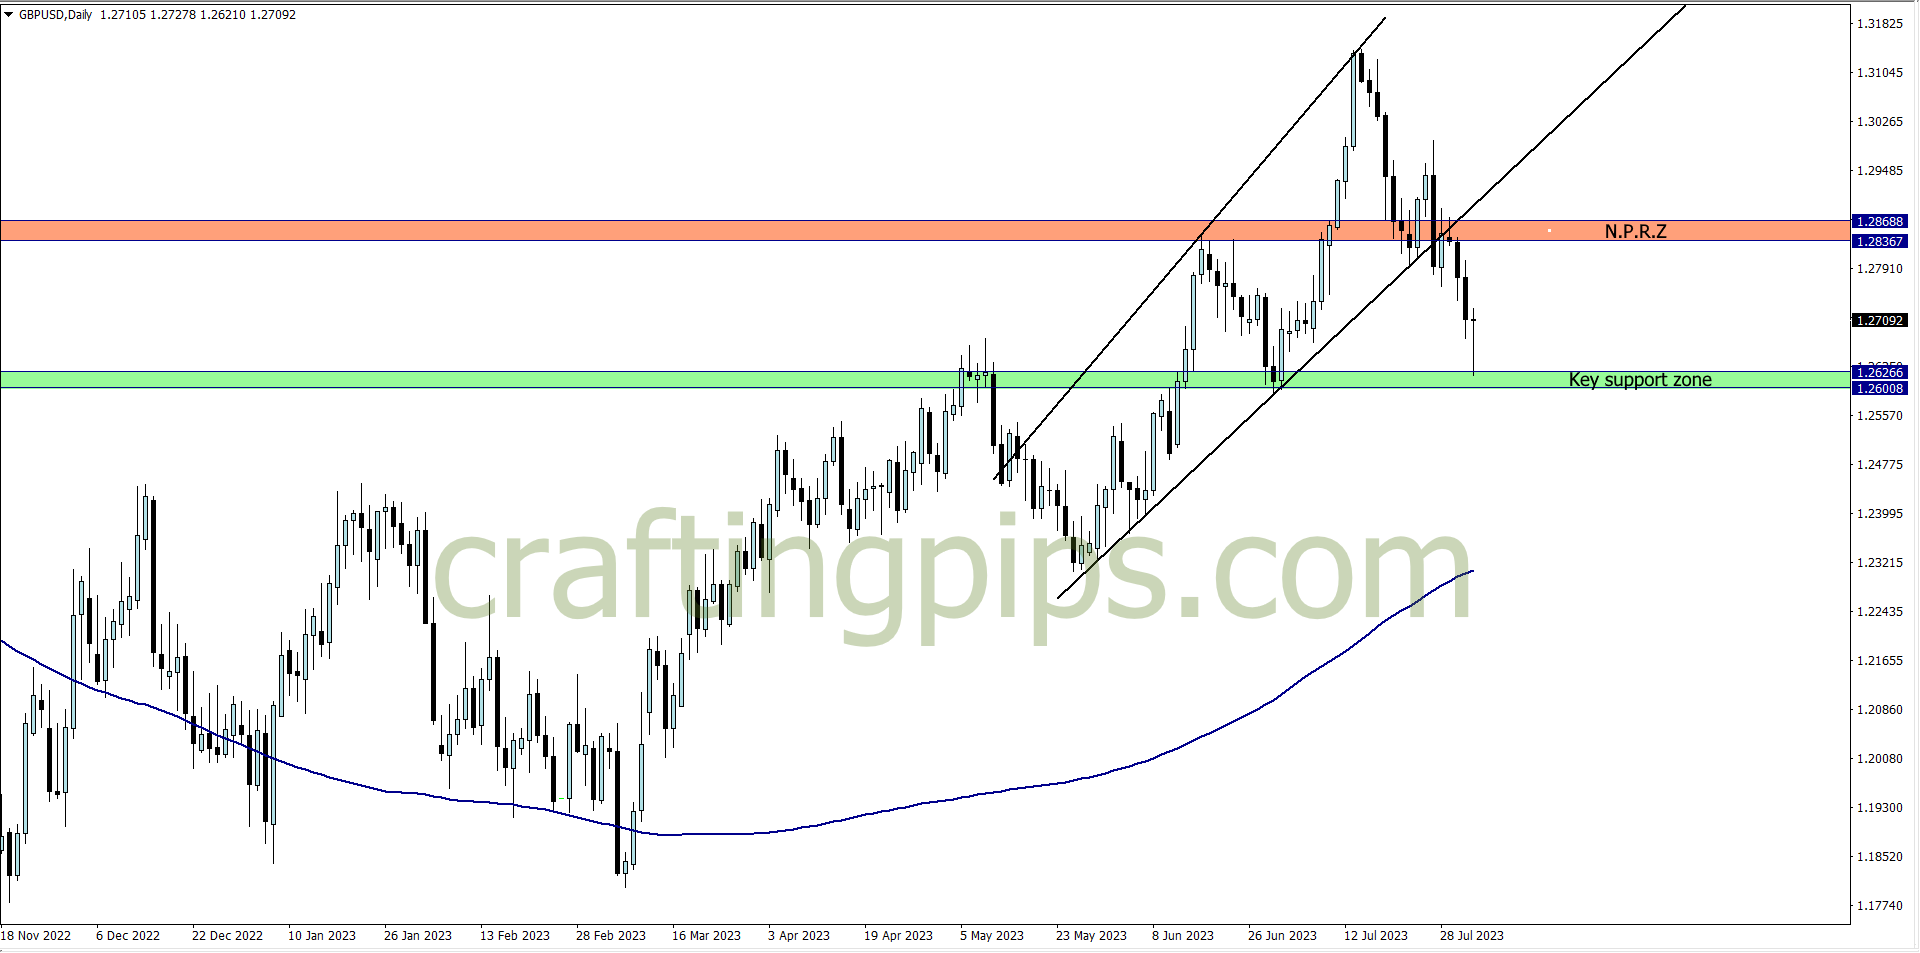
GBP/USD broke a key support zone this week, and fell a little over 200 pips to the current support zone.
Currently we can see a dragonfly doji on a key support zone, which signifies a possible reversal. Between today’s Asian session and Friday’s New York session, we could see a 50 to 80 pips reversal
2. USD/CAD
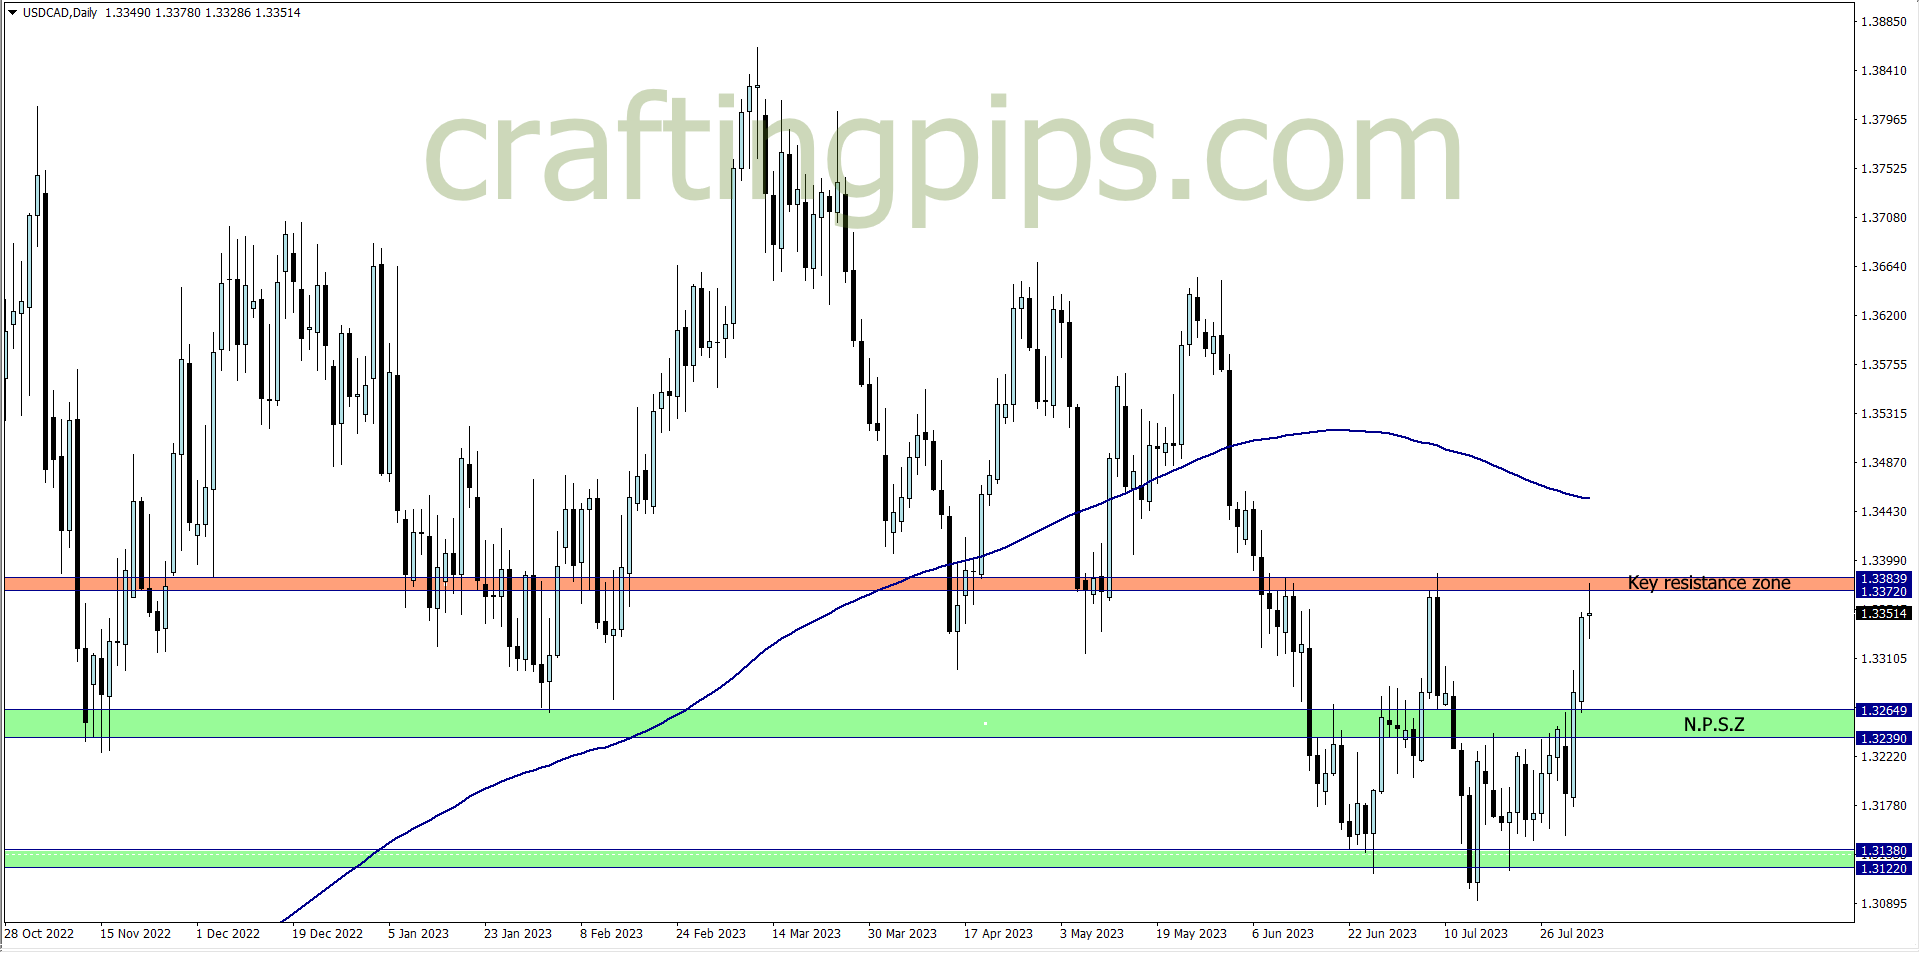
Double tops spotted on the USD/CAD, and price is below the 200 moving average, which signifies that the market is still within the sell zone.
Selling at this point is safe, if you decide to place your stop loss above the key resistance zone, and if also you decide to also exit before CAD unemployment rate (1.30 pm) news tomorrow
Meaning, 50 to 80 pips could be made before the news on Friday
What say you?
NOTE:
-
THE FUNDED TRADER: https://dashboard.thefundedtraderprogram.com/purchasechallenge-n/?sl=3322 (use the coupon code: THE0CRAFTER)
-
MY FUNDED FX: https://myfundedfx.tech/purchasechallenge/?sl=758
- BESPOKE FUNDING PROGRAMME: https://www.bespokefundingprogram.com/The_Crafter?ref=The_Crafter