Good day traders,
It’s Thursday once more, as we get ready for another weekend, let’s flip through our charts and see which of the chart holds a viable trade setup.
1. XAU/USD (GOLD)

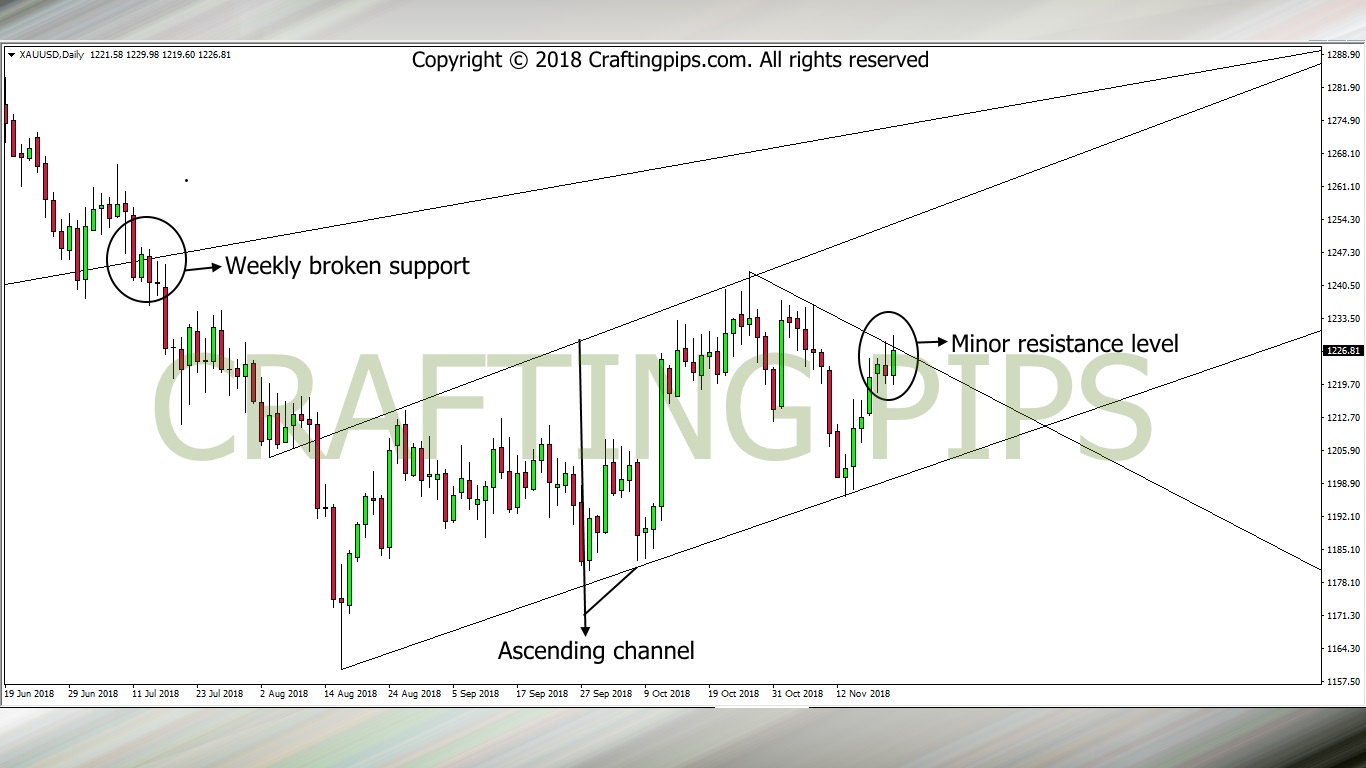
After gold broke through the weekly support (1241.36), it hit a minor support at level at 1159.53 and ever since, it has been on a bullish move, price gradually retracing its steps to a previous resistance level.
On the daily chart, this movement has formed an ascending channel. Presently price is on a bullish move and a descending resistance level is slowing down the bulls at level 1226.97 from a further upward move.
If the current resistance level is broken, we may most likely see the bulls hit its next resistance level (1242.69). If on the other hand, we see a bearish reversal candlestick, we could see price resume a bearish move to a support level 1202.02.
2. NZD/USD

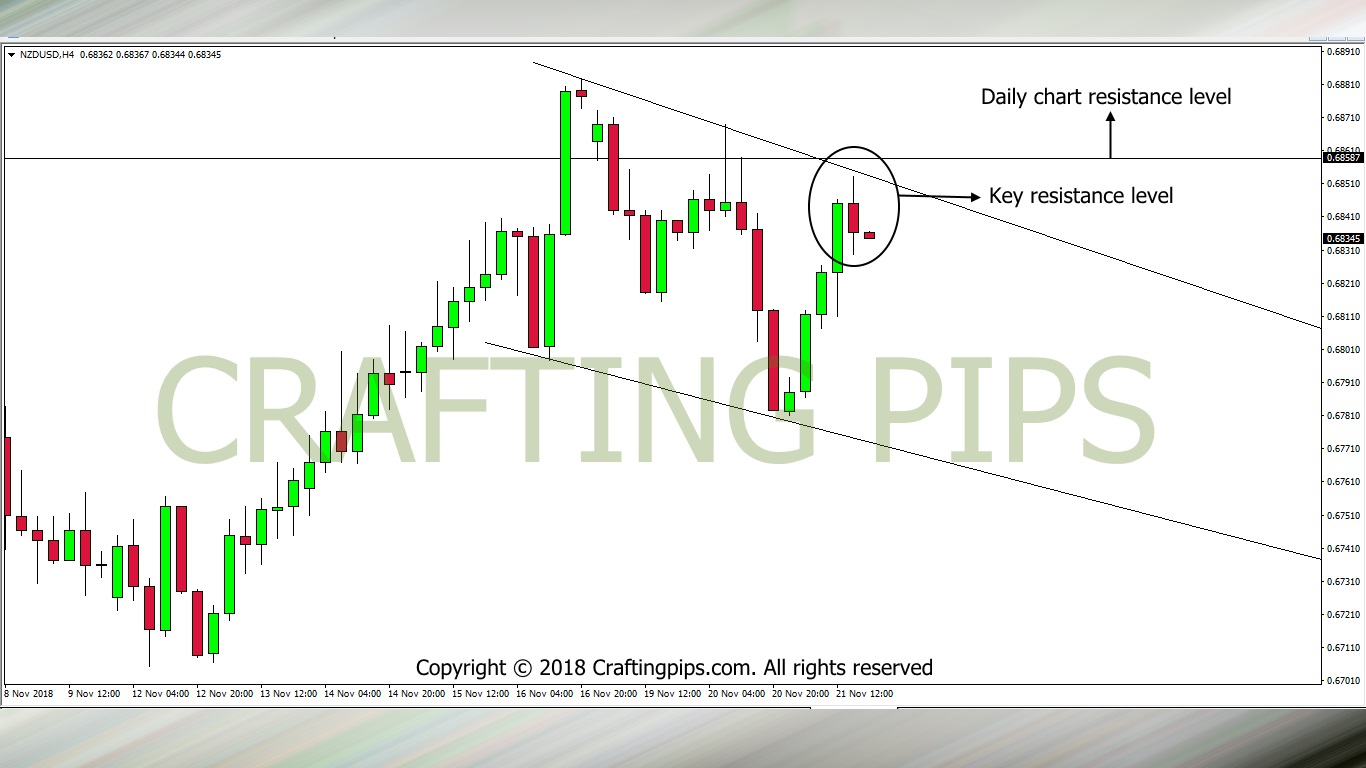
NZD/USD on the daily chart had a phenomenal pull-back after hitting a strong resistance level (0.68587). This has kept price below the resistance level since Monday.
On the 4 hours chart, price has made several attempts to revisit this key resistance level. These continuous attempts has left behind a descending channel. The 3 pm candlestick hit the resistance level (0.68551) and refuse to break through.
Patience would be needed for the confirmation of either a bearish reversal of price to level 0.67699 or a breakout from the resistance level (0.68587) to continue it’s bullish move that may rise beyond level 0.68831.
Do have a great day ahead, don’t forget to comment, share and subscribe.