Hello traders,
let’s see what the charts have for us this first week of February.
1. USD/JPY

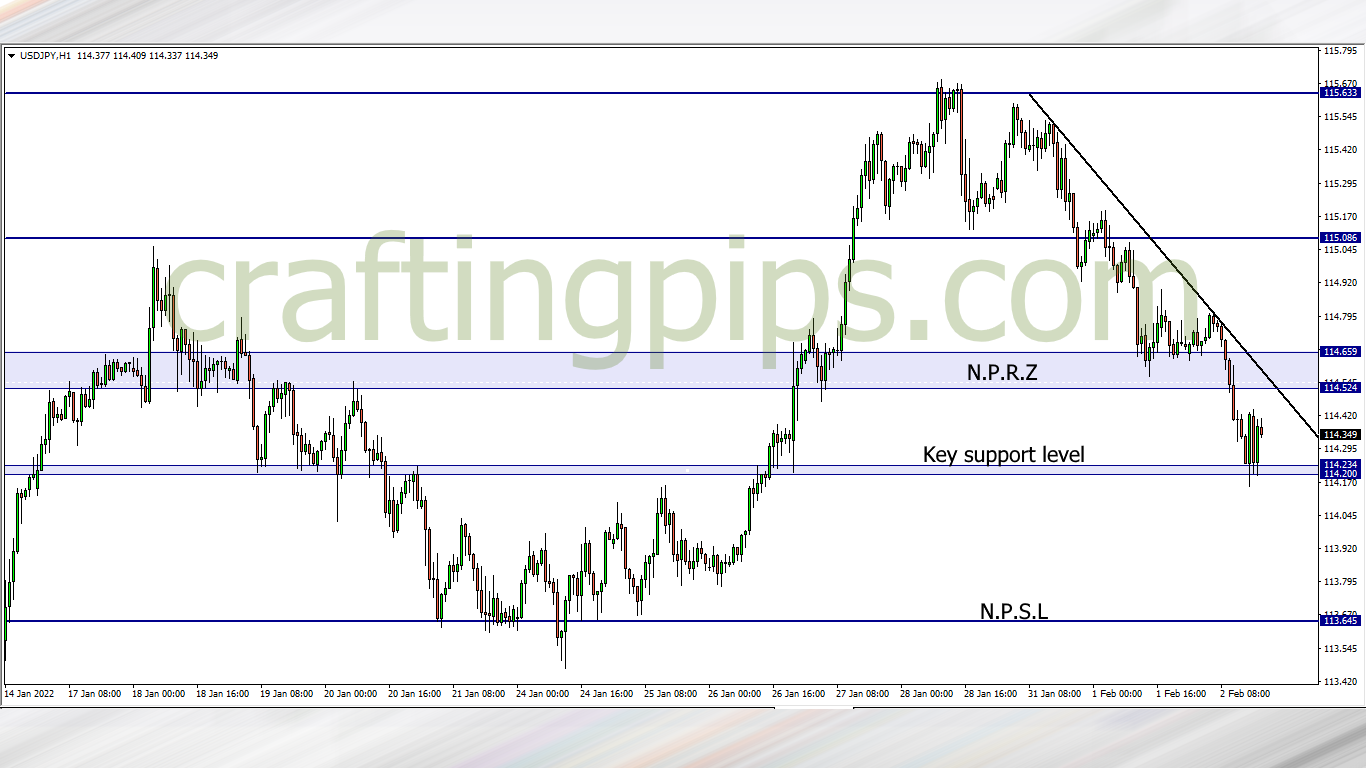
USD/JPY is still bearish and still maintaining the descending trendline that’s serving as a resistance level.
I will be waiting for the key support level to get broken (114.200) before I join the sellers to the next possible support level (113.645)
If the setup defies the above analysis, I will be a spectator rather than trade
2. AUD/USD

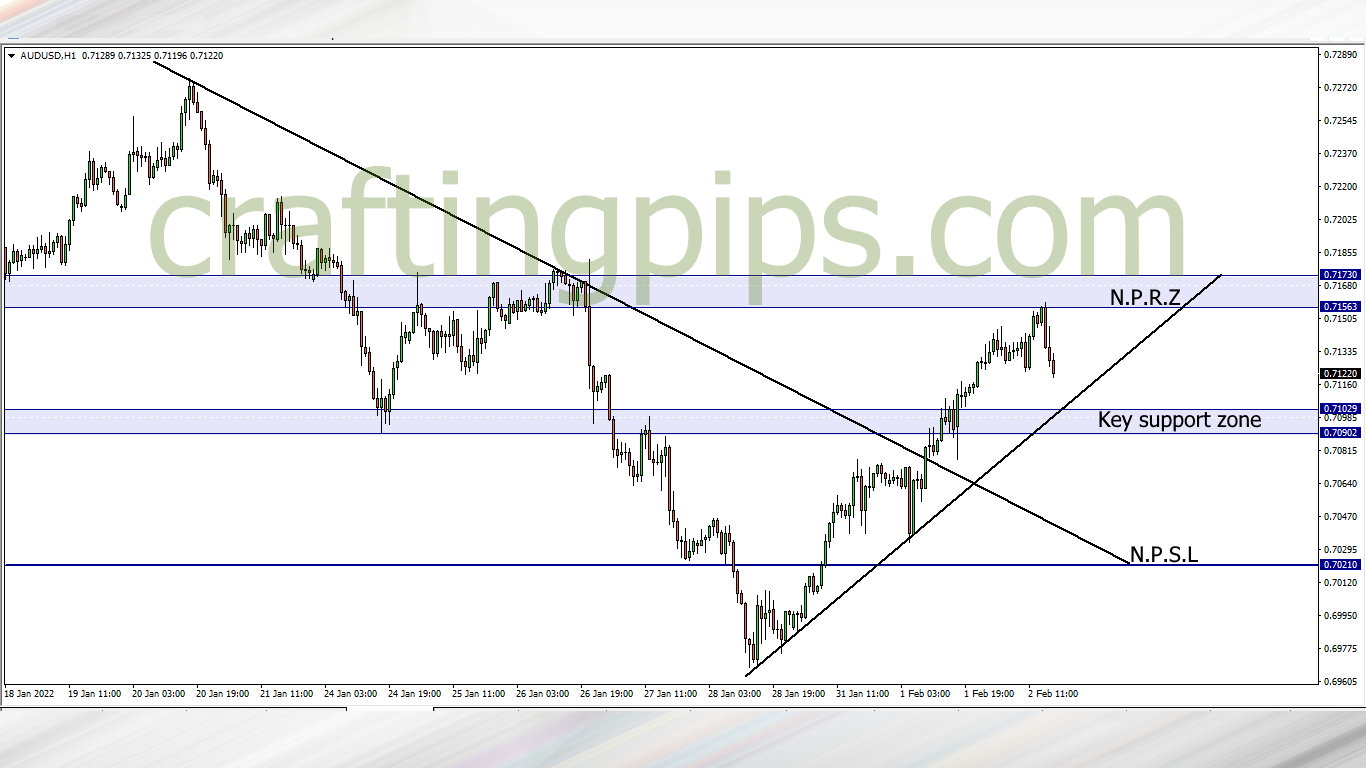
On the 1-hour time frame of the AUD/USD, an ascending trendline has served as a key support level for price.
If price bounces of the key support level, then we may see price return to resistance level 0.71563, but if price breaks the key support level, then the next possible support level will most likely be 0.70210
3. CAD/JPY

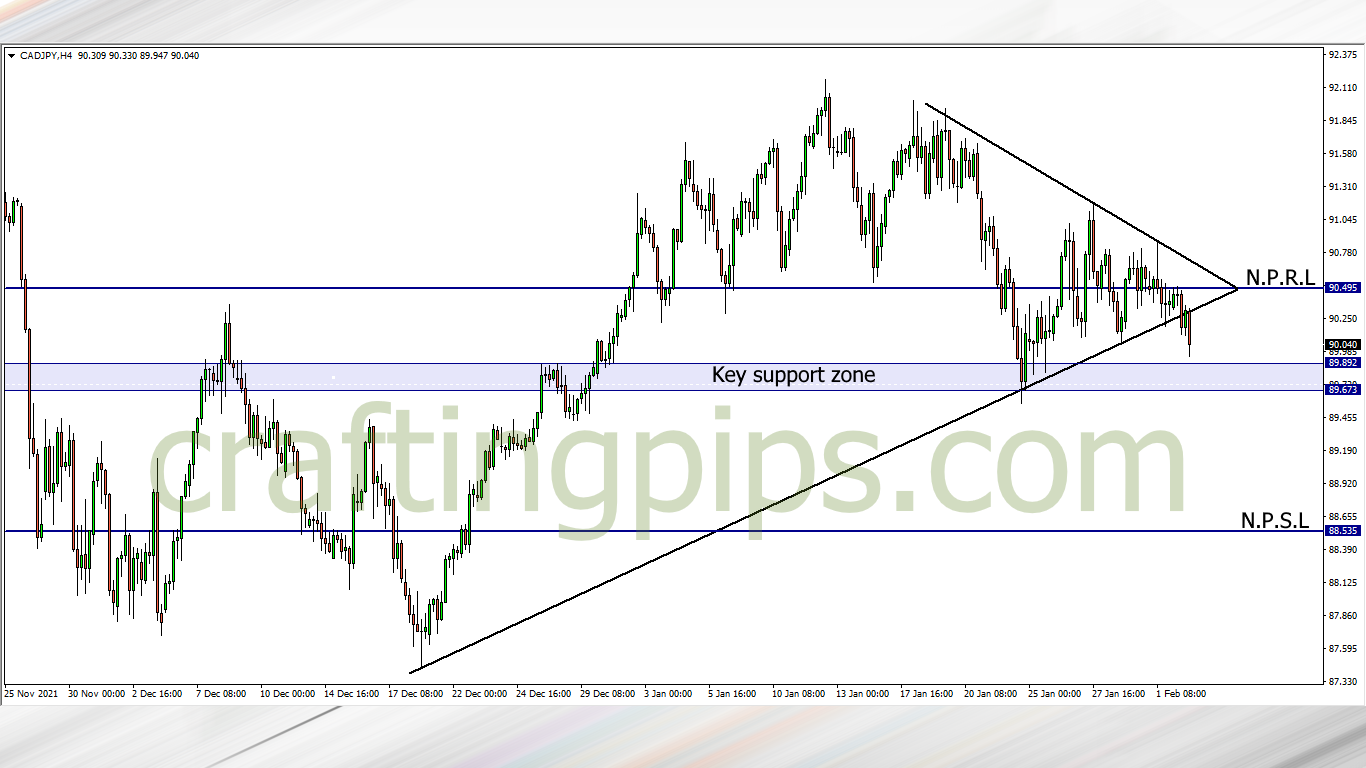
CAD/JPY is roaming around a key support zone.
A breakout means price next possible support level would be 88.535
What say you?
For those who are interested in joining our FREE trading group on Telegram, where trade ideas and trade-related topics are discussed, which could assist your trading career while being infected by positive vibes
hit us on Pip Crafters