Hello Traders,
Let’s dig into our charts…
1. GBP/JPY

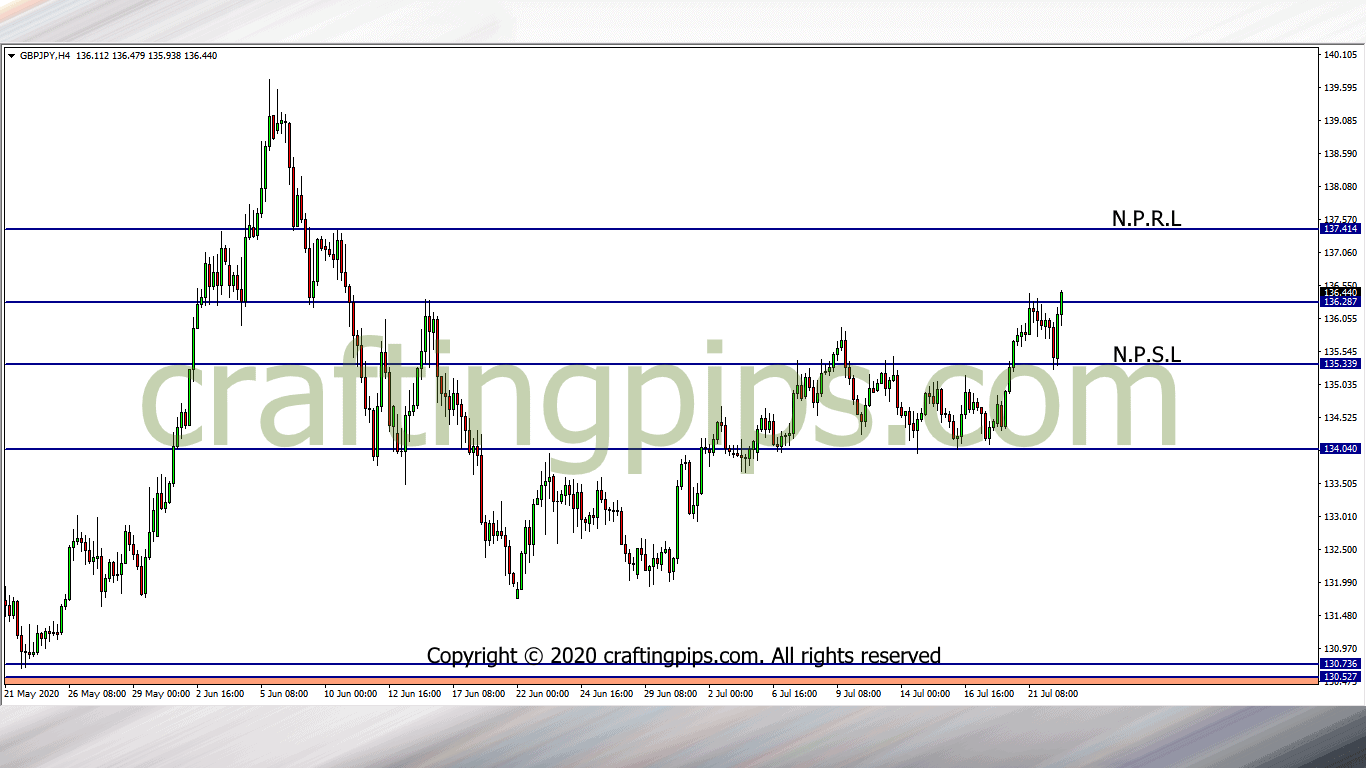
On the 4 hour chart of the GBP/JPY, we can see price testing resistance level 136.287.
Let’s not forget that the present resistance level was once the neck of a head and shoulders formation, hence making it a very critical level.
If a breakout is confirmed, we may most likely see price hit the next possible resistance level (137.414).
If the Bulls for any reason fizzle out, price may fall back to previous support level 135.339
2. EUR/JPY

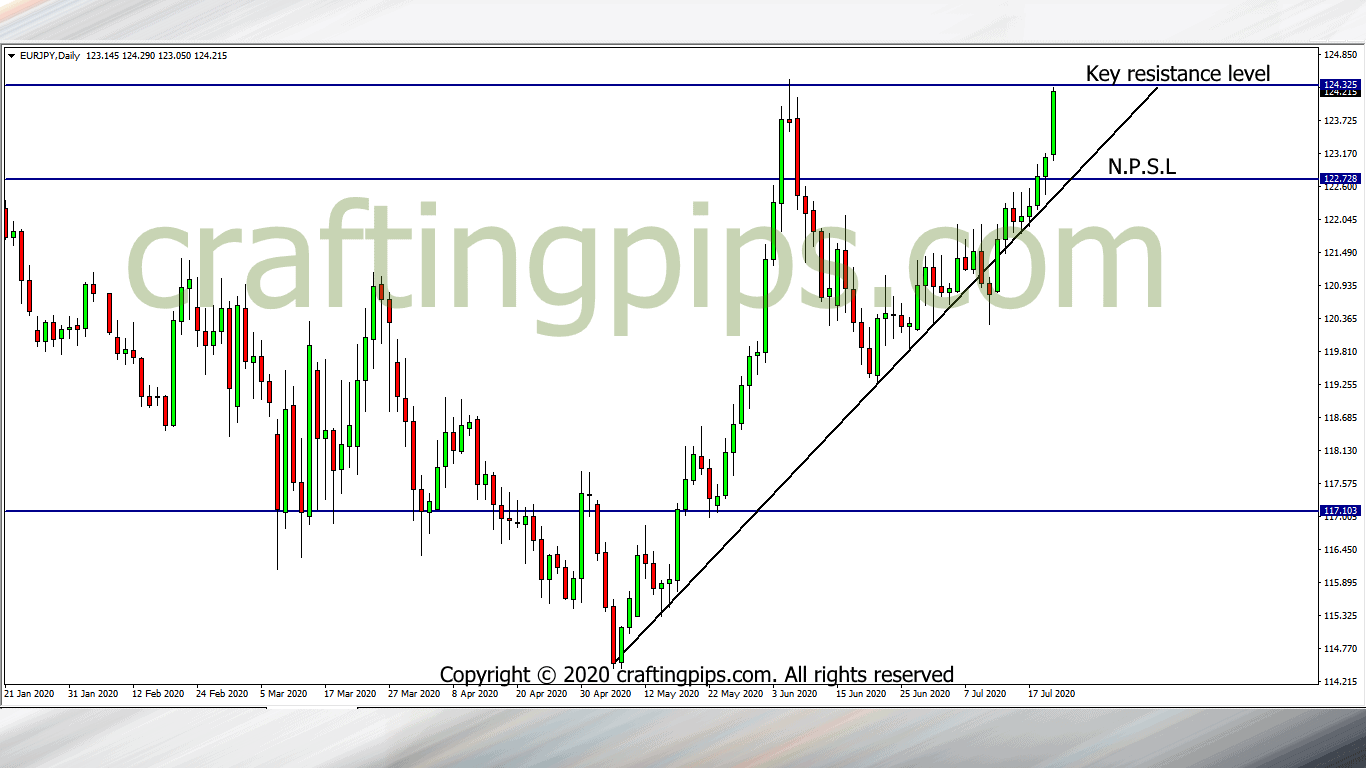
On the EUR/JPY, the Bulls had quite a day at the office today.
They practically drove price over +100 pips to resistance level 124.325.
Are we going to see price consolidate for a while before a reversal occurs, which may take price back to support level 122.728? , or
Are we going to see get a breakout which may drive price to the next possible resistance level (125.817)?
3. AUD/JPY

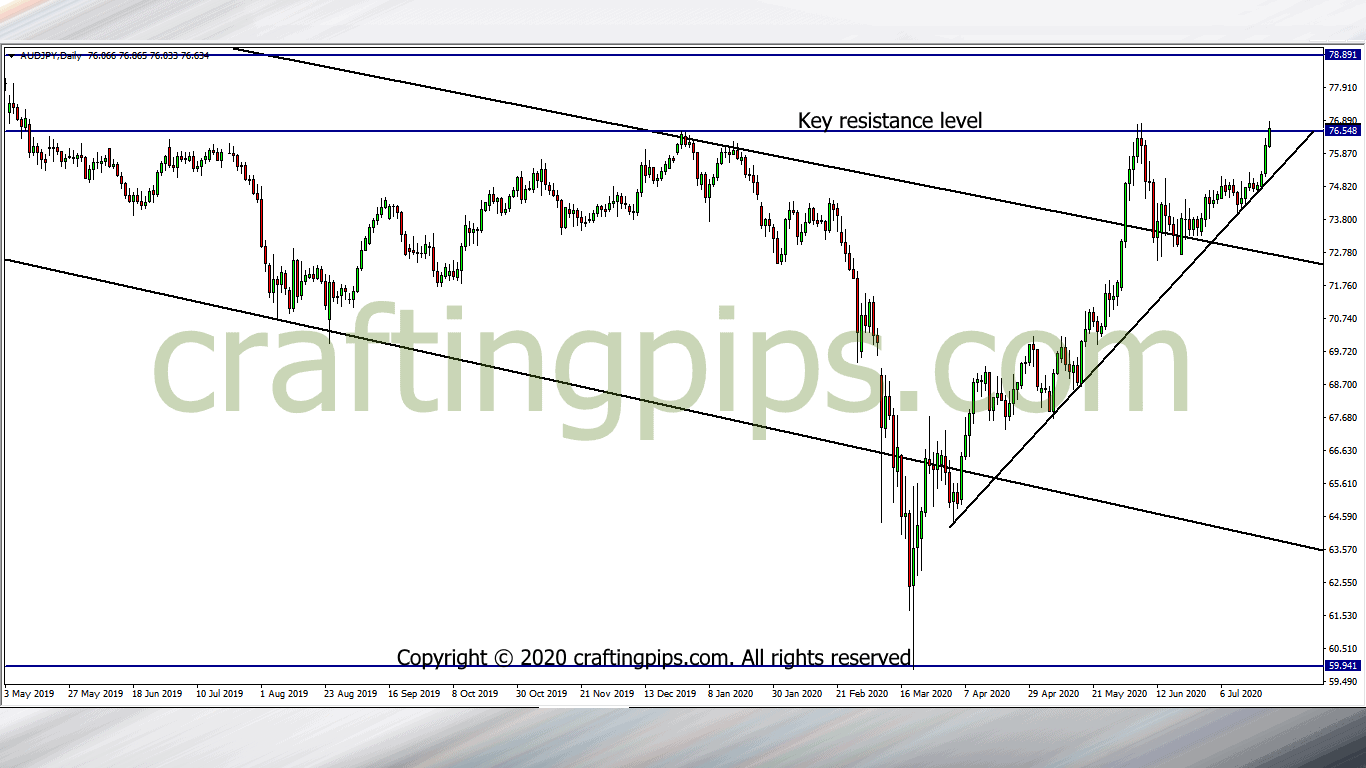
The AUD/JPY looks quite interesting.
Price is re-testing a key resistance level (76.548) it once tested exactly a month ago.
Are the buyers going to rise to the occasion this time and drive price to the next possible resistance level (78.891) after the breakout? or
Are we going to see the sellers disrupt the uptrend in the market, which may cause a level of consolidation?
What are your thoughts?
ATTENTION: For those who are interested in joining our FREE trading group on Telegram, where trade ideas are discussed, which may assist your trading career while being infected by positive vibes
Smash the link: https://t.me/joinchat/FN30PxlwXbk2BcuTDdH5yg