Hello traders,
let’s hit the charts:
1. EUR/JPY

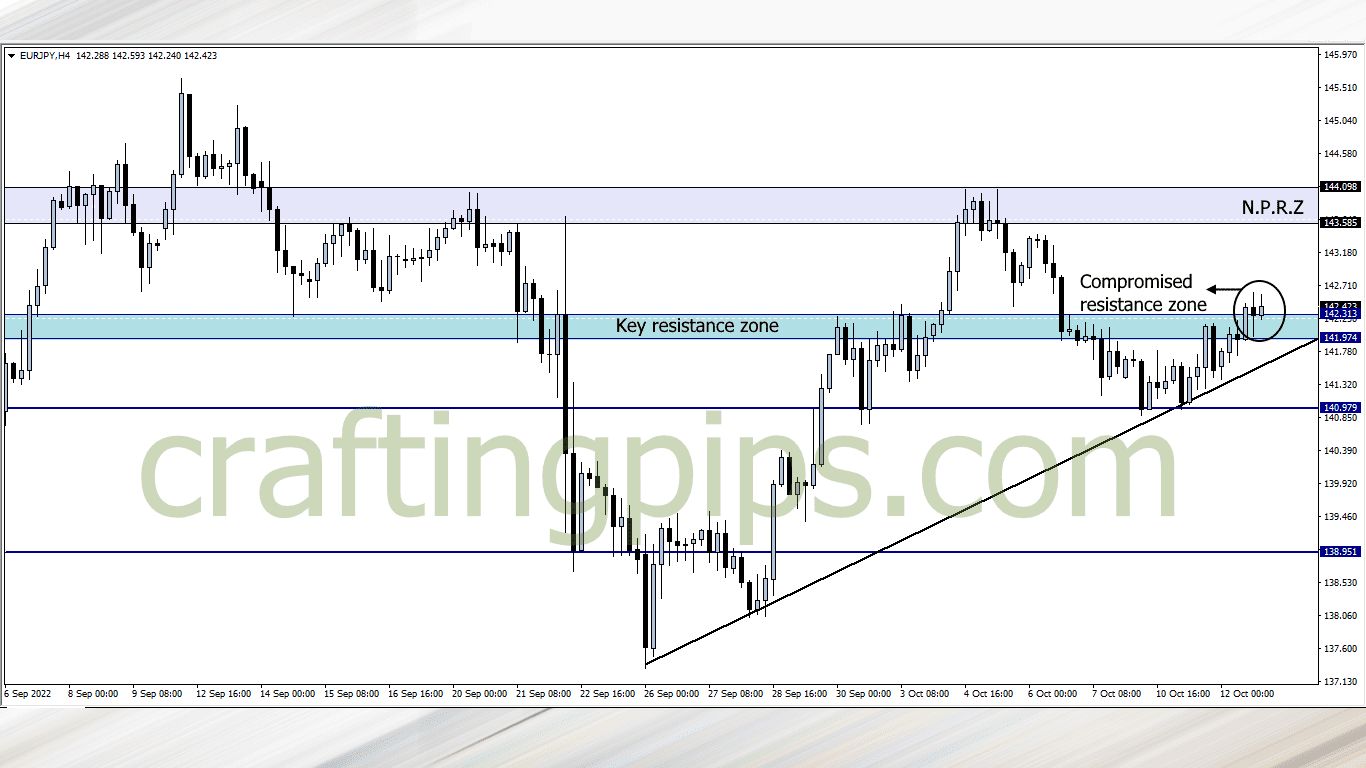
Higher lows and and higher highs can be seen formed on the EUR/JPY.
If the daily candlestick closes above the key resistance zone, then we may most likely see price hit the next possible resistance zone before the close of Thursday’s London session
2. EUR/AUD

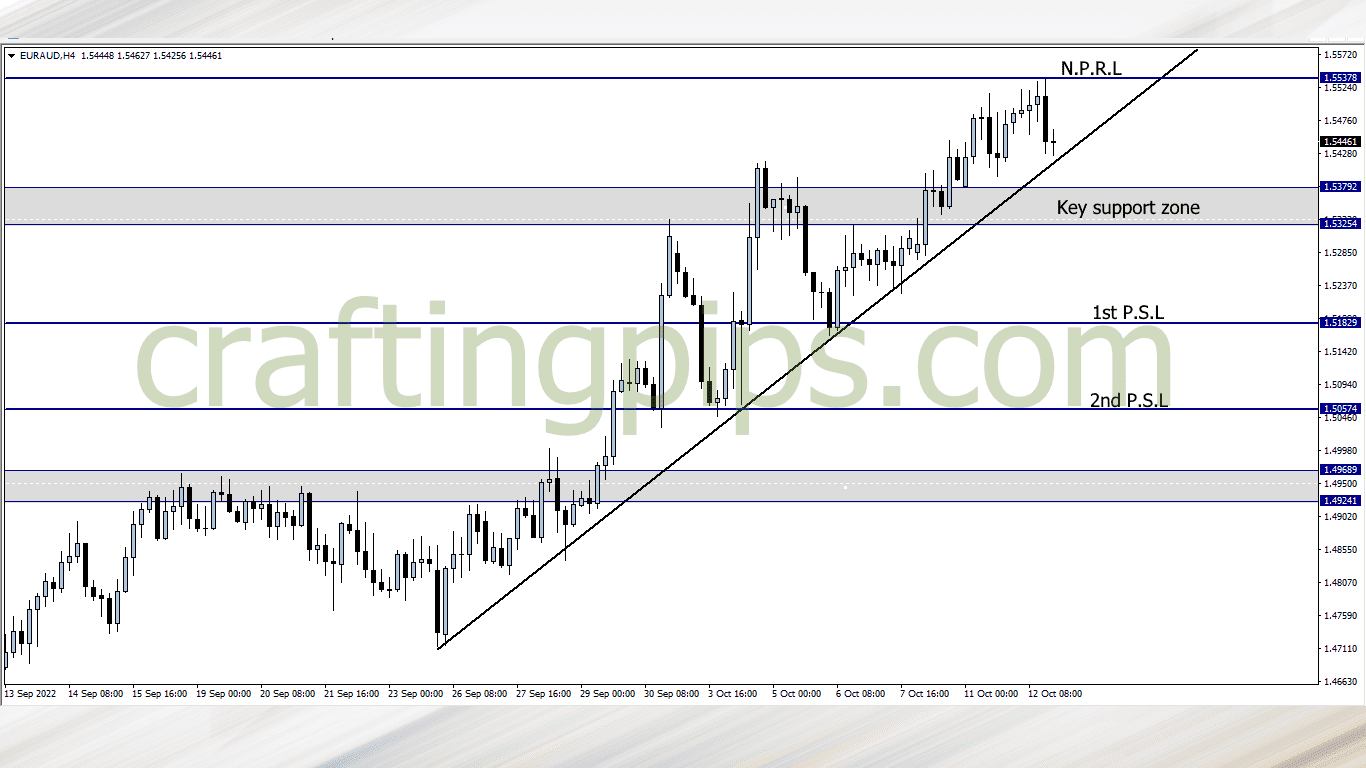
EUR/AUD started bullish at the beginning of the week, all we may be seeing now is a pullback before price continues its bullish campaign.
If price continues bullish, then our first possible resistance level would be 1.55378. If the buyers are still strong after hitting 1.55378, then we may see price reach 1.55976
If the bulls fail and price turns bearish, price will first have to break the key support zone before we join the sellers to the next possible support level (1.51829)
3. AUD/JPY

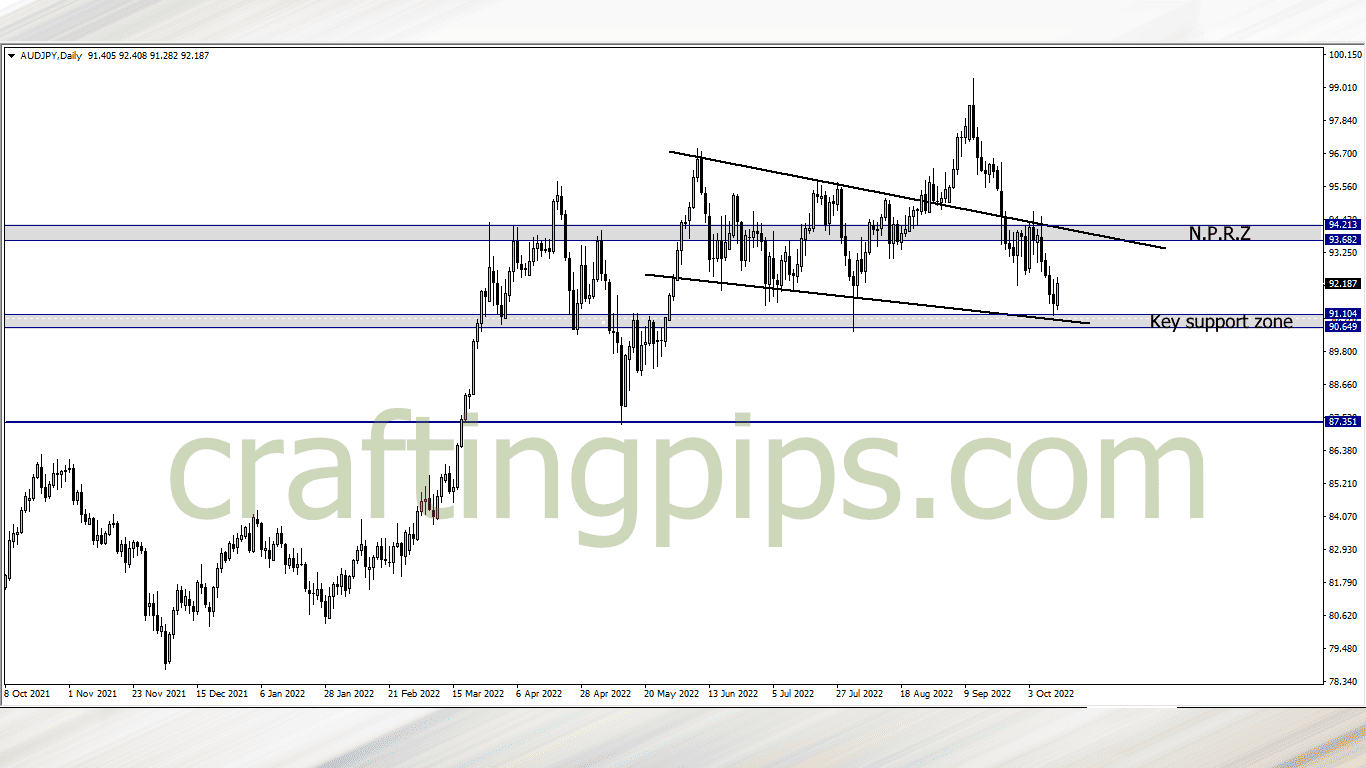
On the AUD/JPY, price is currently respecting a key support zone, and the base of a descending channel.
There is a huge likelihood that price may revisit the previous support zone (93.682 – 94.213)
What say you?
Traders who are interested in joining our FREE trading group on Telegram, where trade ideas and trade-related topics are discussed, which could assist your trading career while being infected by positive vibes
hit us on Pip Crafters
NOTE:
Hello traders, Are u tired of wasting your money on failed prop firm challenges?
Say no more…
Fundyourfx is willing to give u a DIRECT FUNDED account at an affordable price If u are interested, contact me & get my coupon code for a -5% discount.