Hello Traders,
What are we waiting for?
Let’s hit the charts…
1. AUD/USD

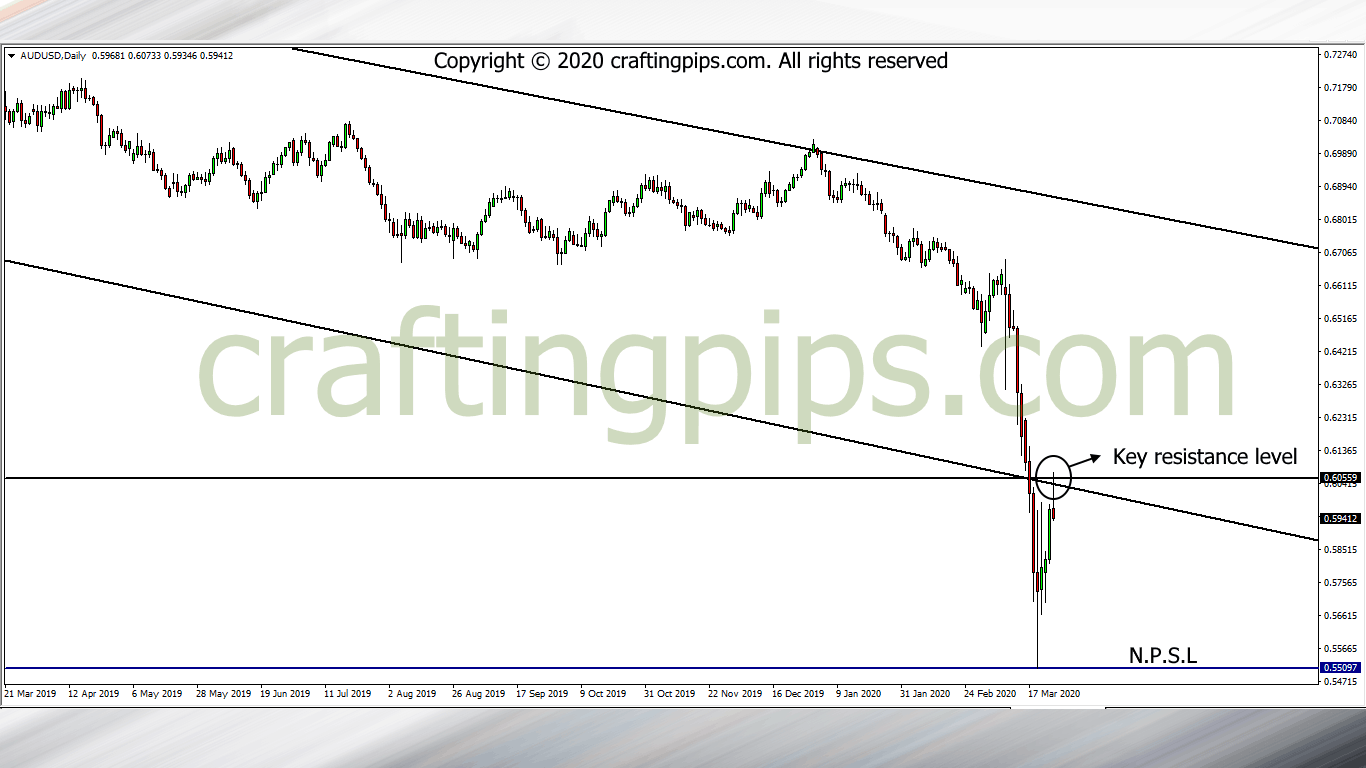
On the weekly chart of the AUD/USD, price broke through the support level(0.60559) of a descending channel.
On the daily time frame, we can see what seems to be the end of a pull-back materializing.
There is a likelihood that the Bulls may be getting fatigued. The bearish pin-bar presently seen on the daily time frame may be too early to judge price next move, but it’s something to watch out for today at 11 pm.
2. NZD/USD

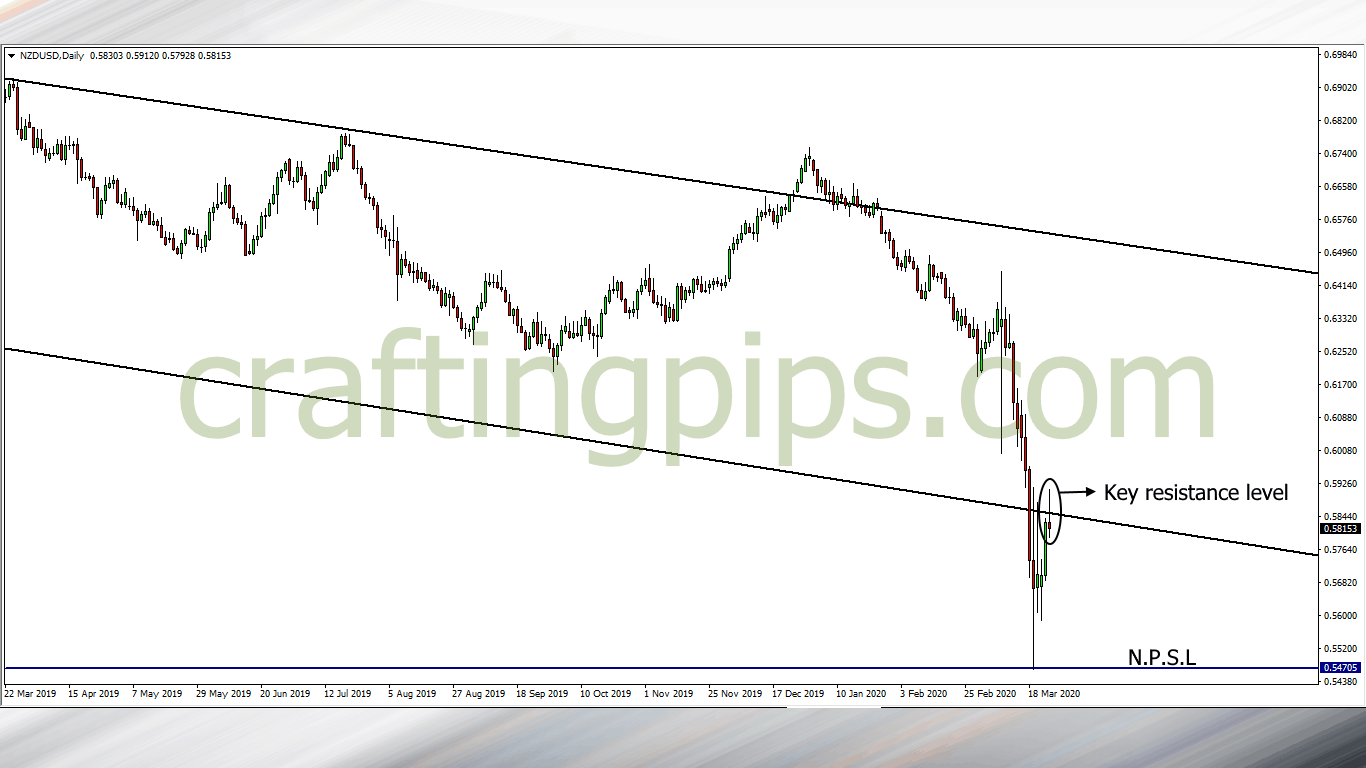
NZD/USD has almost the same formation as AUD/USD.
The close of the daily candlestick may give us a clue of where pips will spill next.
If a reversal is confirmed, we could be looking at over 300 pips move to the next possible support level (0.54705).
What are your thoughts fam?