Good day fellow traders,
You are welcome to the 3rd week of the month of September. Last week was awesome as our analysis had over 70% success rate.
That said, let’s see what this week’s market hold’s for us.
1. EUR/USD

We analysed the EUR/USD last week Sunday, today we are having a follow up to the analysis we did last week.
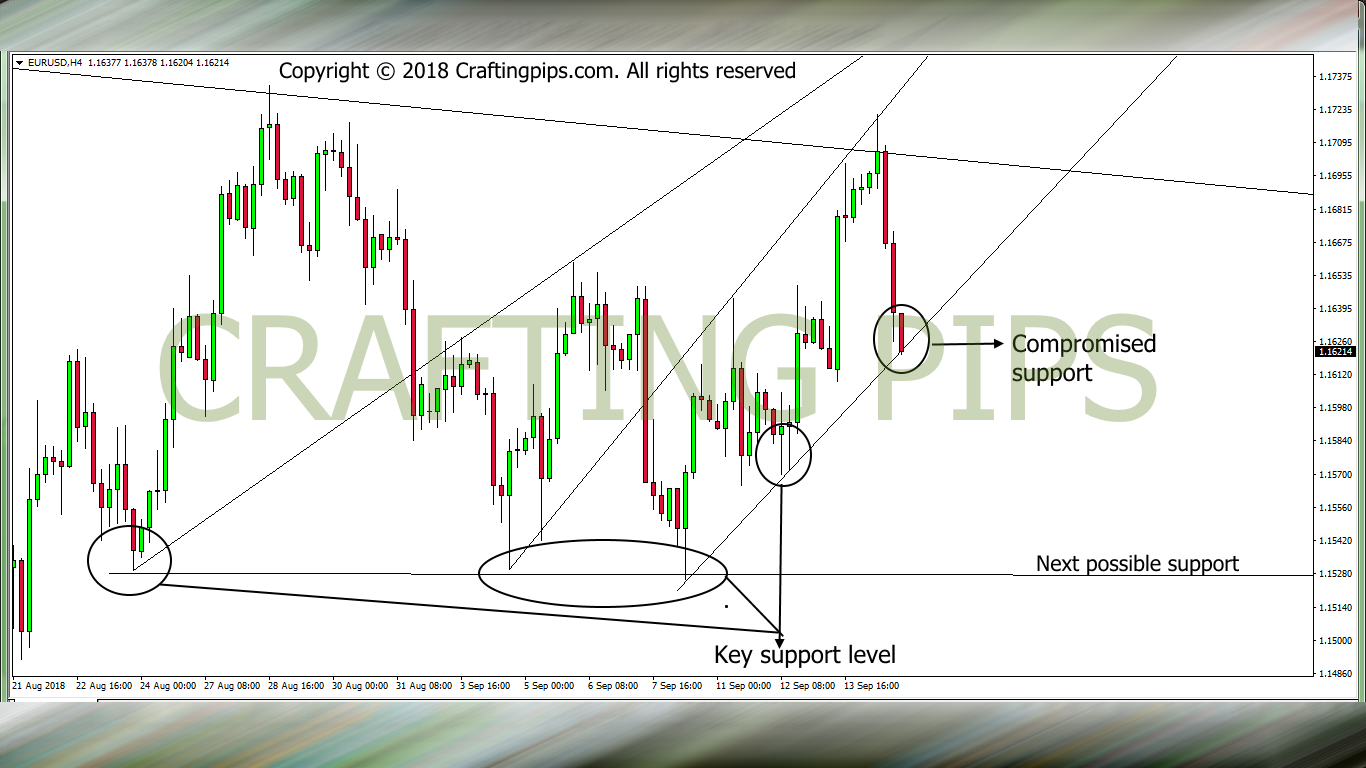
EUR/USD is currently in a descending channel when viewing the daily setup. If we narrow it down to the 4 hours chart, we will see that price is currently resting on a key support area (1.16218).
A breakout of this support level will drive a bullish price to hit the next support level (1.15318) and a rebound on the same support level may see price play around (16502 – 1.16218) before finally breaking out of the support.
2. EUR/JPY

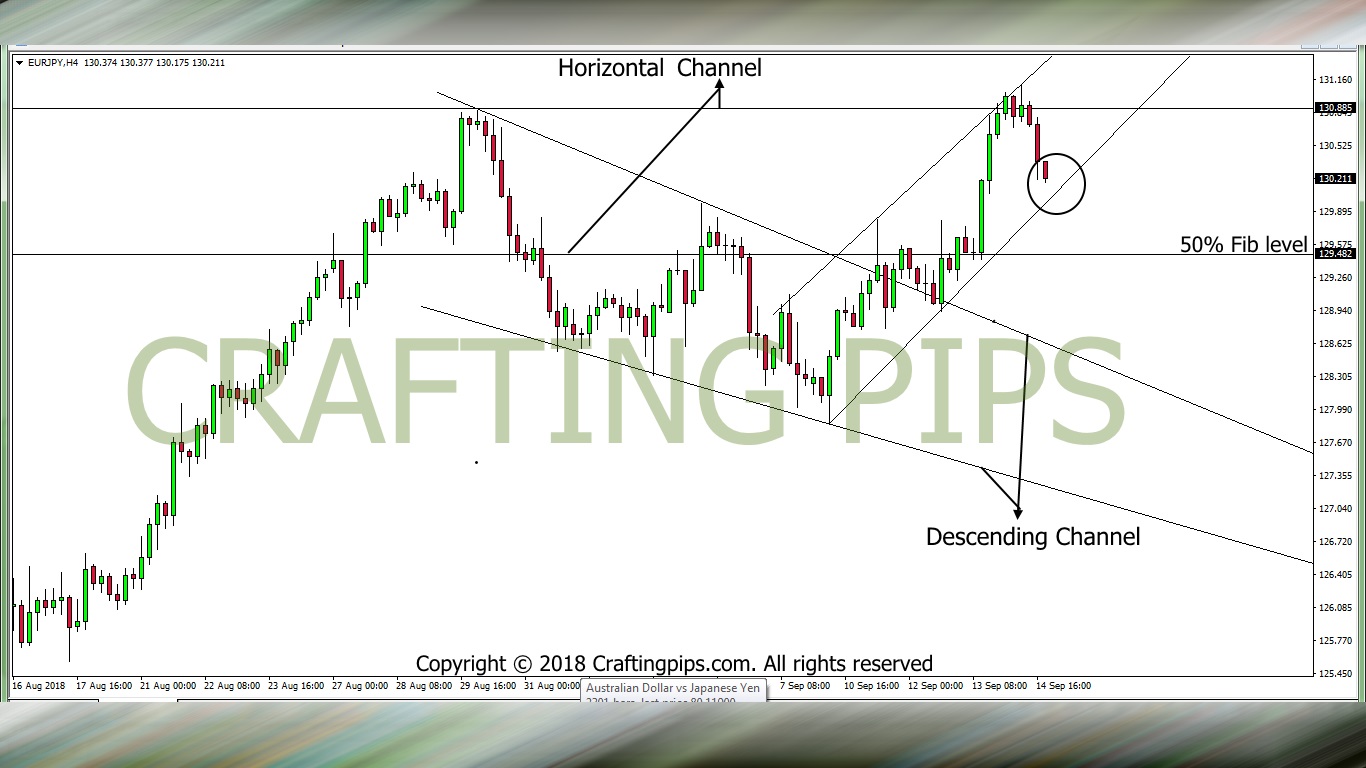
EUR/JPY on a daily chart is currently on a key resistance area (130.885). When looking through the 4 hours chart, we would observe that there is a fine ascending channel formed and price is approaching a key support level (130.066).
A breakout from this support would send price to the next support level which is the base of a horizontal channel and coincidentally a 50% Fibonacci retracement level.
However, the support level could also be strong enough to send price back up to resistance level 130.885.
3. GBP/JPY

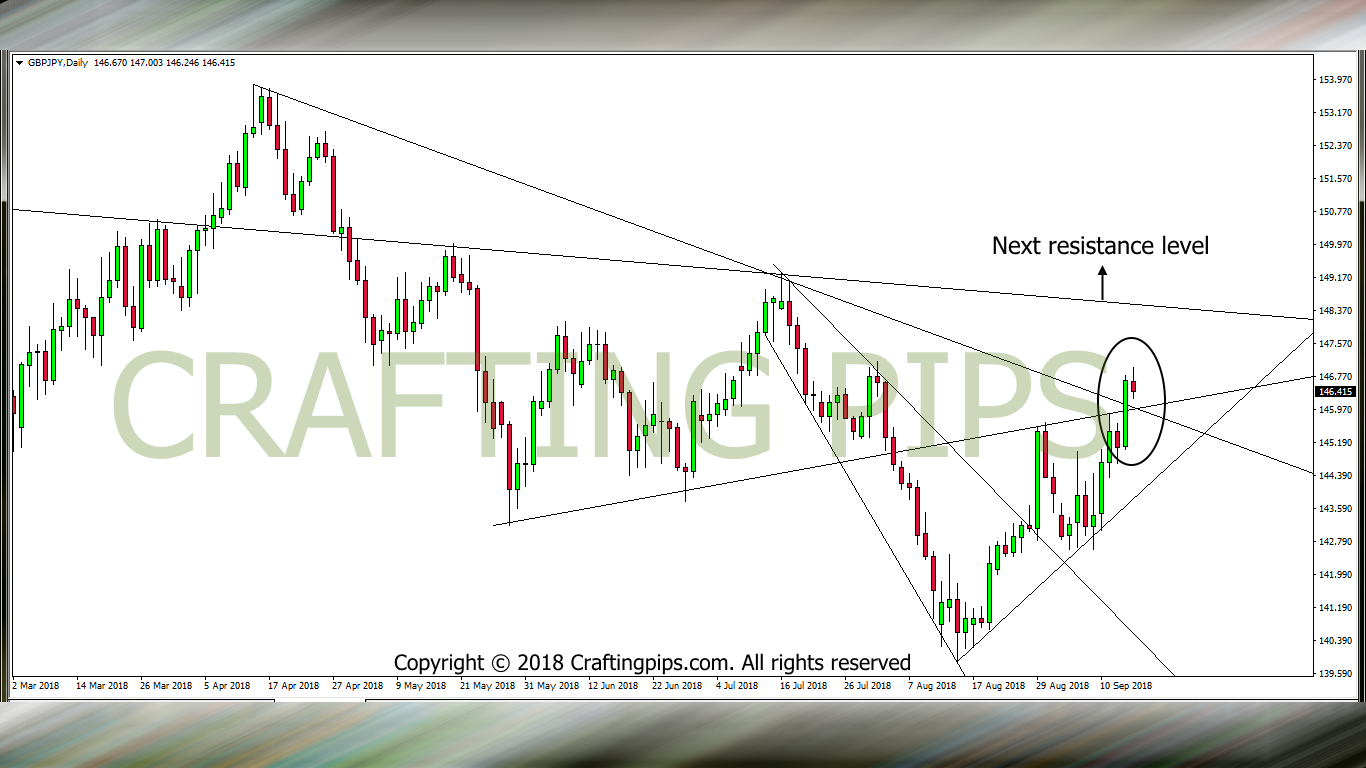
On the daily chart GBP/JPY looks like Spiderman’s web (lol), however these different trendlines were drawn to actually ascertain where price is most likely leading us to.
Currently on GBP/JPY, bullish price movement broke out from a key intersection (a point where two or more trend-lines cross) point, and resistance level (145.951).
The market closed on Friday with a slight retracement of price. There is most likely to be a bullish run this coming week if the breakout is sustained on Monday and Tuesday.
3. AUD/JPY

The AUD/JPY was looked into last week Sunday
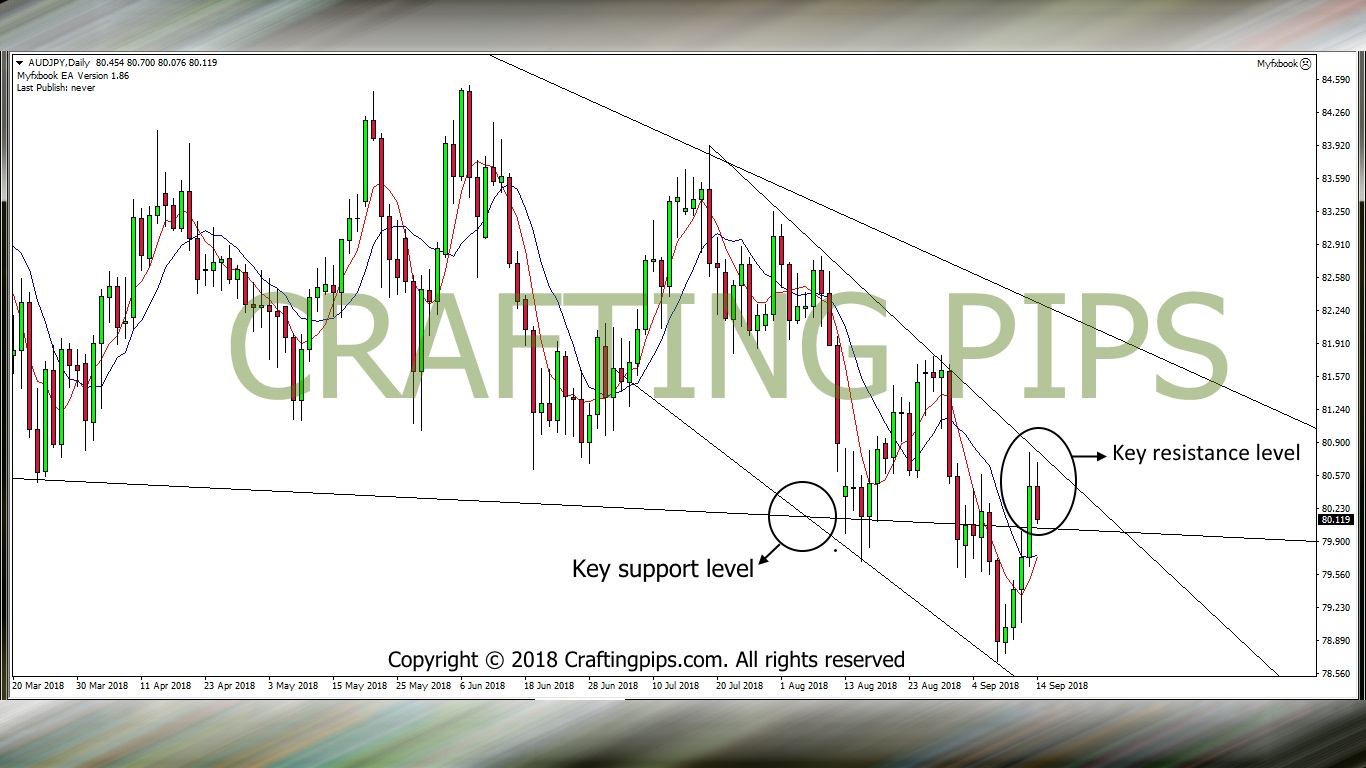
After a price breakout on the weekly chart, we saw this pair retrace to hit a resistance level (80.804) on the daily chart. We may see price resume it’s bearish trend if a key support level (80.029) is breached on the daily chart.
Comment below if you have contrary views or if our analysis is helping your trading decisions.
Do have a great week ahead.