Good day traders,
So excited, It’s the last week of the month, and that calls for another bookkeeping for the month of September.
Treating your forex trading career as a business is the only way to becoming a profitable trader. If you don’t keep records, you can’t measure your progress over time.
If you can’t measure your progress, you will most likely keep on going round in circles, until the day you throw in the towel, believing that forex trading is either another SCAM or NOT just for you.
Anyways, let’s go to our charts for the week.
1. AUD/JPY
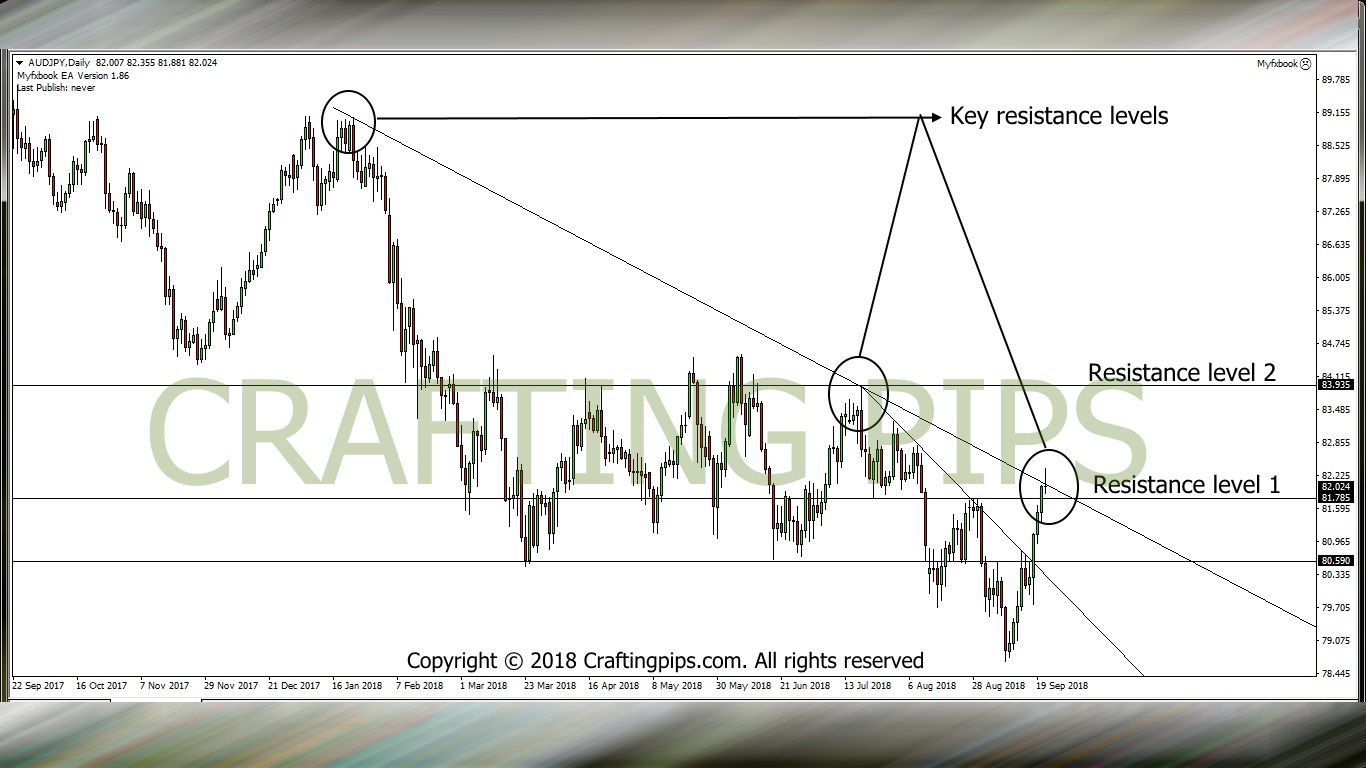
AUD/JPY started a bullish run last week Tuesday. On Friday the bulls were halted by a trend line which originates from January this year. We saw Friday’s candlestick end with a doji.
This signifies that the market closed indecisively, meaning the buyers and sellers PAUSED their battle last week at the close of the market on Friday.
This week, we will be watching out how price will react to the TREND-LINE (82.084) and former resistance (81.785) that was broken on Thursday last week.
If price breaks the current trend-line, we may see price go above level 83.364 before the close of the market this week Friday. If on the contrary, price is rejected by the trendline (82.084) and present support (81.785), we may see price fall beyond 80.905.
2. AUD/USD
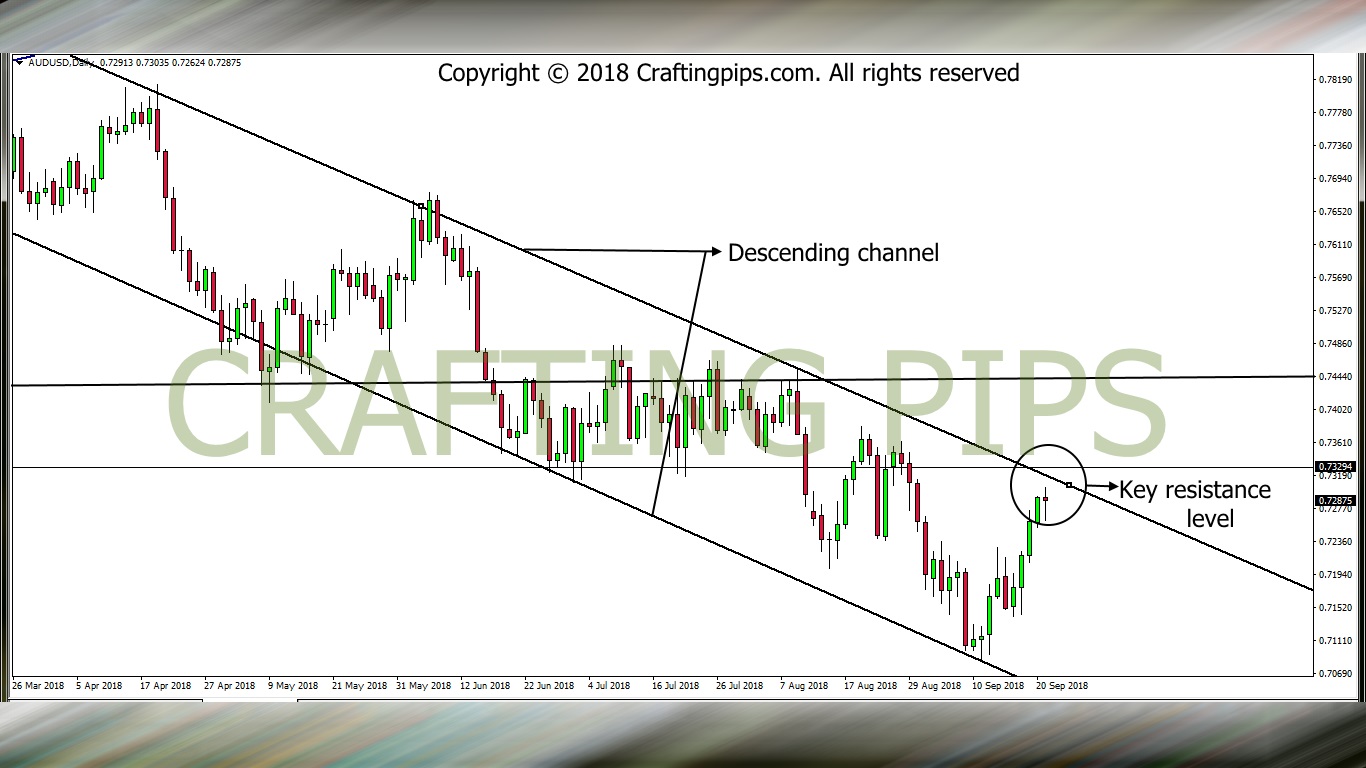
The AUD/USD is simply straight forward.
Since February 2018, this pair has been locked withing a descending channel, if you also draw your horizontal trend lines properly, you would also realize that the current price is almost touching key horizontal resistance level.
A key level to watch-out for is the intersection between the horizontal and descending trend line formed by the channel (0.73166).
If price crosses this intersection, we may see the bulls take price to level 0.74531, on the other hand, if price respects this STRONG RESISTANCE LEVEL, we may most likely see price hit level 0.71457 before the close of market on Friday.
3. EUR/USD
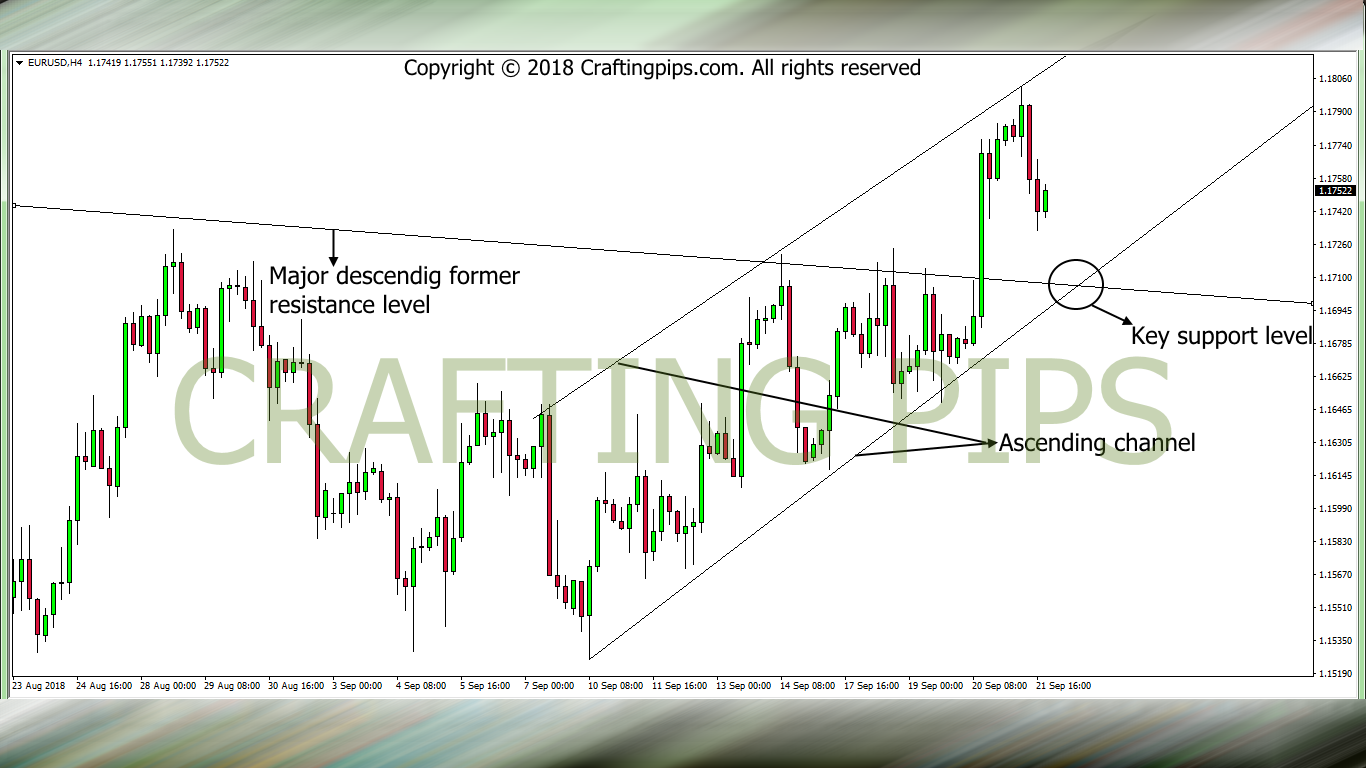
If you view EUR/USD on a DAILY time frame, you will observe that this pair broke out from a descending channel on Thursday. At the close of Friday’s market, we observed a pull-back.
When this pair is viewed on a 4 hours time frame, we will observe that the pull-back may revisit an intersection 1.17051 which has been formed by the base of ascending channel and the previous resistance level which may currently serve as a support.
If price is pushed down by the bears to touch this intersection, two things could happen
- The bulls may most likely take price to level 1.17930 in order for the daily breakout to continue its trend or
- The bears may break the intersection on level 1.17051, and this may force price below the next support level 1.16547.
NOTE: Monday’s are very unpredictable, I always advice traders to observe the market till Tuesday’s or late Monday’s (New York sessions) before trading any of the analysis we give here.
If you have contrary views to our analysis or if our analysis has helped you in any way, please comment below and share.
That said…
Do have a profitable week ahead.
![]()
![]()
![]()
![]()
![]()
![]()