Happy Sunday Legendary Traders,
It brings great joy to my soul knowing that October will be coming to an end by Wednesday. Meaning, we will be doing some record keeping on our journal for the month of October by midweek.
At the same time we need to be ready for the new month of November which commences on Thursday. Talking about getting ready for the month of November, lets head straight into our charts and see what this week has in store for us.
1. USD/CAD
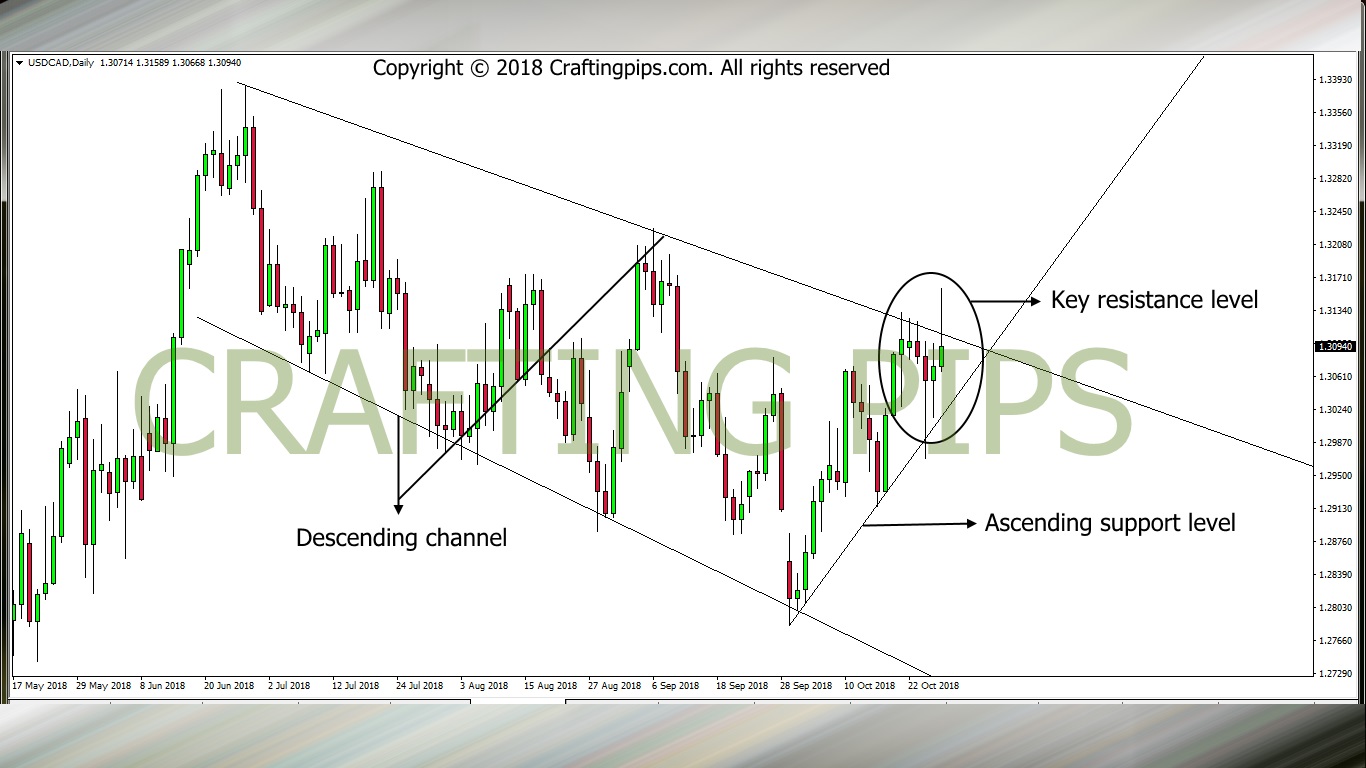
Judging from the USD/CAD weekly time frame, the bulls assisted price to bounce off a key support area (1.27847) three weeks ago, thereby forming the third leg of an ascending channel
On our daily chart, USD/CAD shows that price is presently squeezed between an ascending support line and a descending resistance line.
In my opinion, the USD is still very much bullish and I expect a bullish breakout from the current resistance level (1.31077). If the bullish breakout is confirmed, we may see price hit its next resistance level (1.32244)
That said, we may also experience a slight bearish reversal before the bulls kick in. Looking out for a bullish confirmation before taking this trade is important
2. GBP/CHF
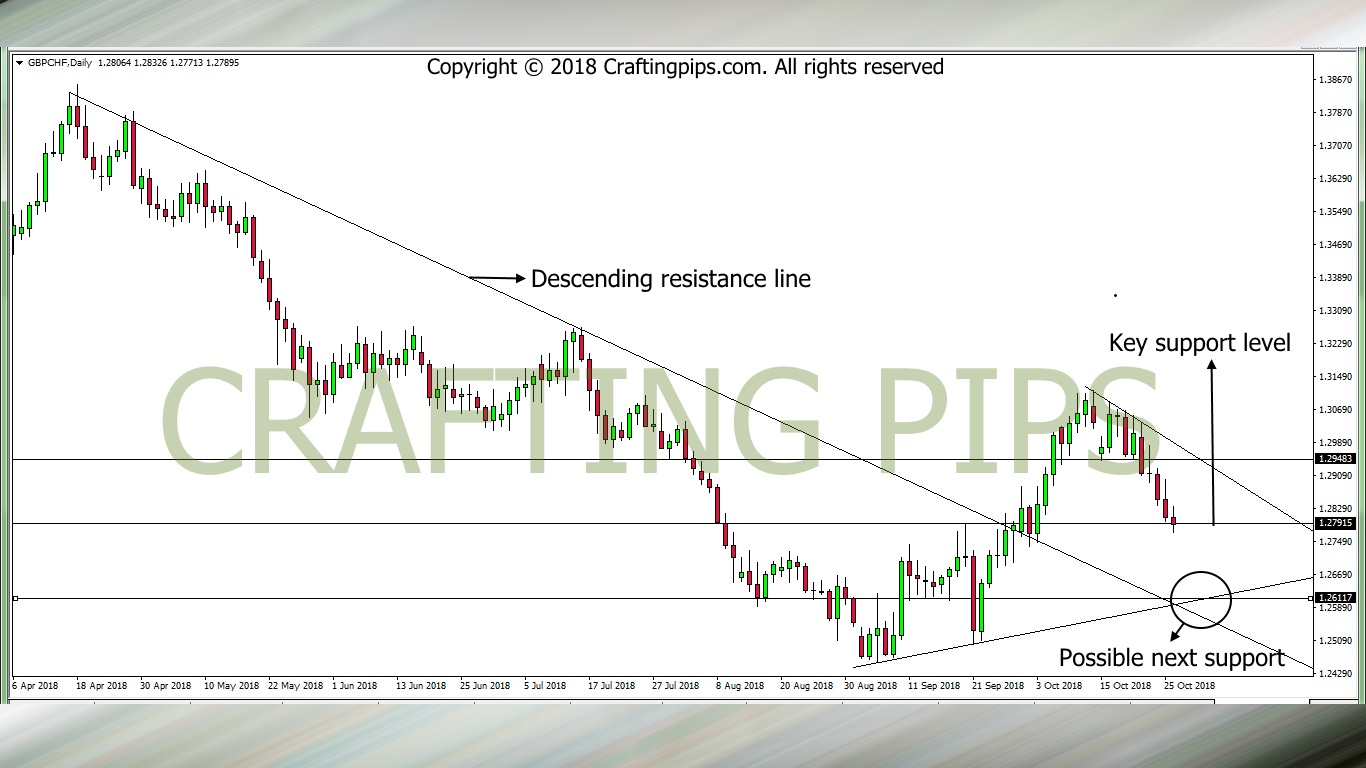
GBP/CHF has been on a downward move for over 2 weeks now.
At the close of the market last Friday, price stopped at a key support level (1.27915) which coincidentally is also a 23.6% Fibonacci retracement level. You would agree with me that this support level is a weak one, but hey never get too cocky in forex.
A bearish breakout confirmation is all we need before hitting the sell button on this pair. If that occurs, the next possible support level is where there seem to be a support resistance intersection (A price level where two or more support or resistance levels cross paths).
When trading this pair, you need to also be cautious, just in case a slight pull back or a bullish reversal occurs.
3. EUR/JPY
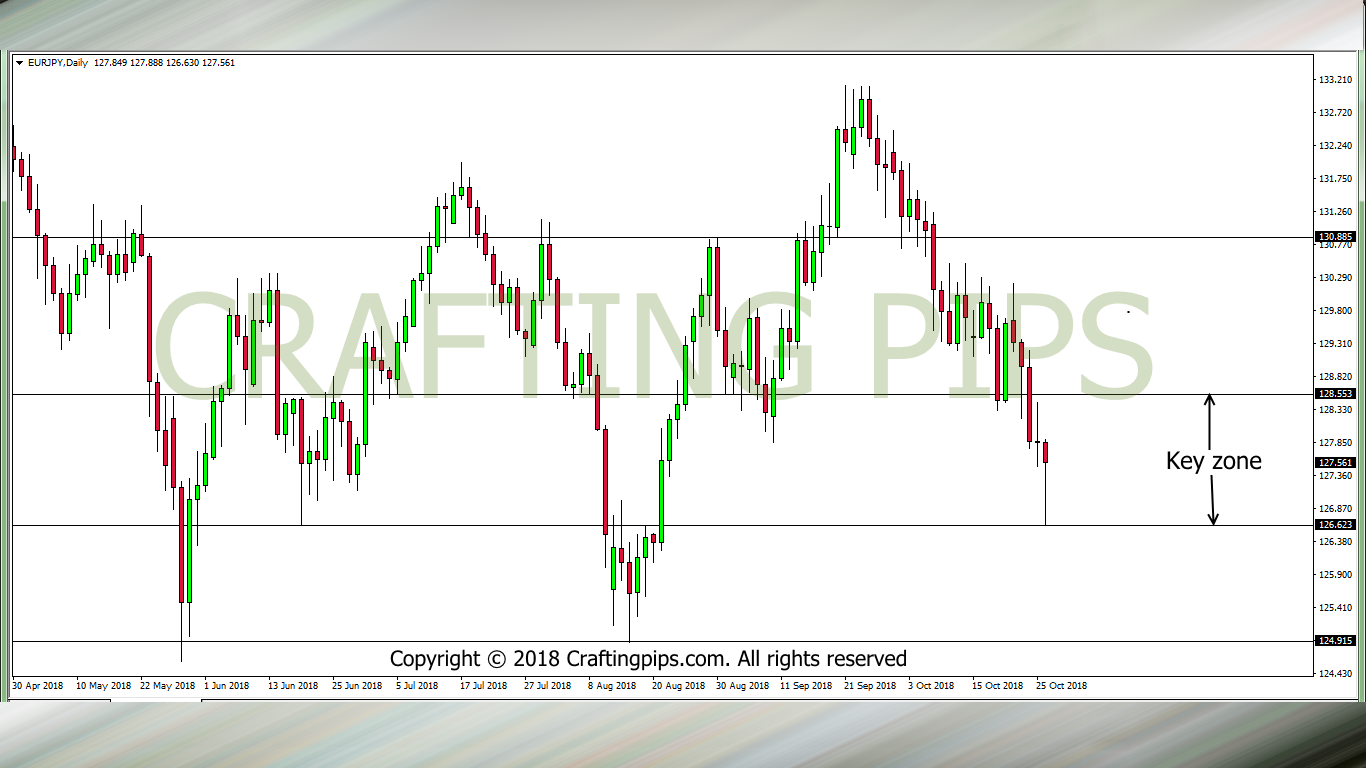
Looking at the EUR/JPY through the daily time frame, its pretty straight forward. Price is currently locked within a range (128.528 and 126.623).
A breakout from any of the key levels (128.528 or 126.623) would determine if we buy or sell. A breakout from the resistance level 128.528 may provoke the bulls to take price above level 129.715 and a bearish breakout through level 126.623 could take price below level 125.282.
Hopefully before the week runs out, we should have a clearer picture of a confirmed price direction.
4. EUR/CHF
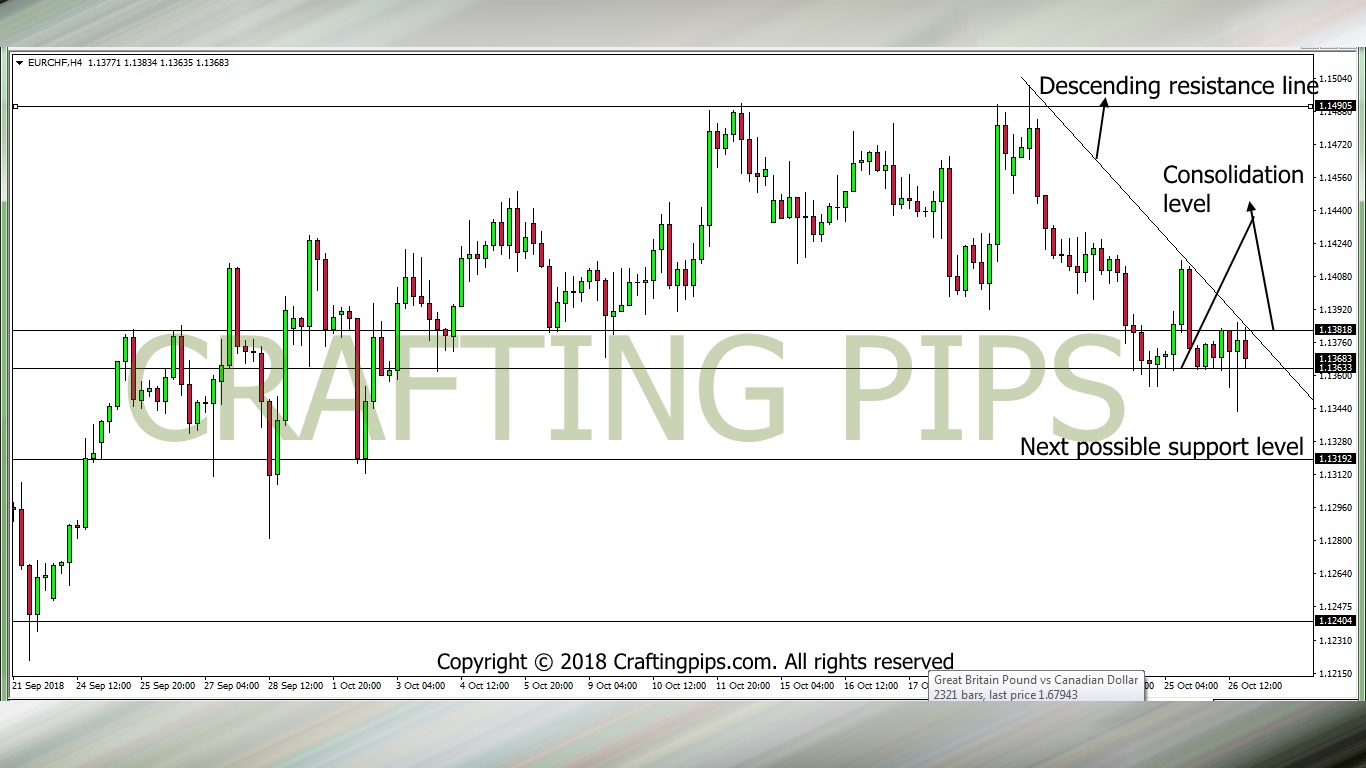
On the 4 hours chart of EUR/CHF, price has been locked between 1.13818 and 1.13633.
The descending resistance line kept the bulls in check and the horizontal support (1.13633) also kept the bears at bay. This has been ongoing for over 2 days.
We will be looking our for a bearish breakout this new week before committing to this trade. If the breakout occurs, the next support level would be 1.13192.
That said, remember that most Monday’s are unpredictable and extreme caution should be applied when executing trades.
That said, I am wishing you a GRAND LAST WEEK of the month of October and a GREAT NEW WEEK of the month of November.
Kindly share an comment
![]()
![]()
![]()
![]()
![]()
![]()
Thanks for your analysis they make forex simple God bless
You are welcome Nkambule,