Hello Legendary Traders,
Let me be the first to welcome you into the month of September.
“I welcome you all to the last month of the third quarter”.
The month of August was a crazy one. There were fewer viable trades and loads of fakeouts. The end of the summer holidays should increase the liquidity of the market, hence, better setups should come across our way.
I was watching a documentary on Crocodiles over the weekend and something hit me:
In difficult time, the Crocodile’s ability to stay without eating for months is a huge plus and a survival skill that has made them one of the most successful predators.
A successful trader can be likened to a Crocodile. Some months present scarcity and capital preservation is of the essence.
I think I should whip out an article on this in the future.
Alright alright, let’s see what the first week of September holds for us.
1. USD/JPY
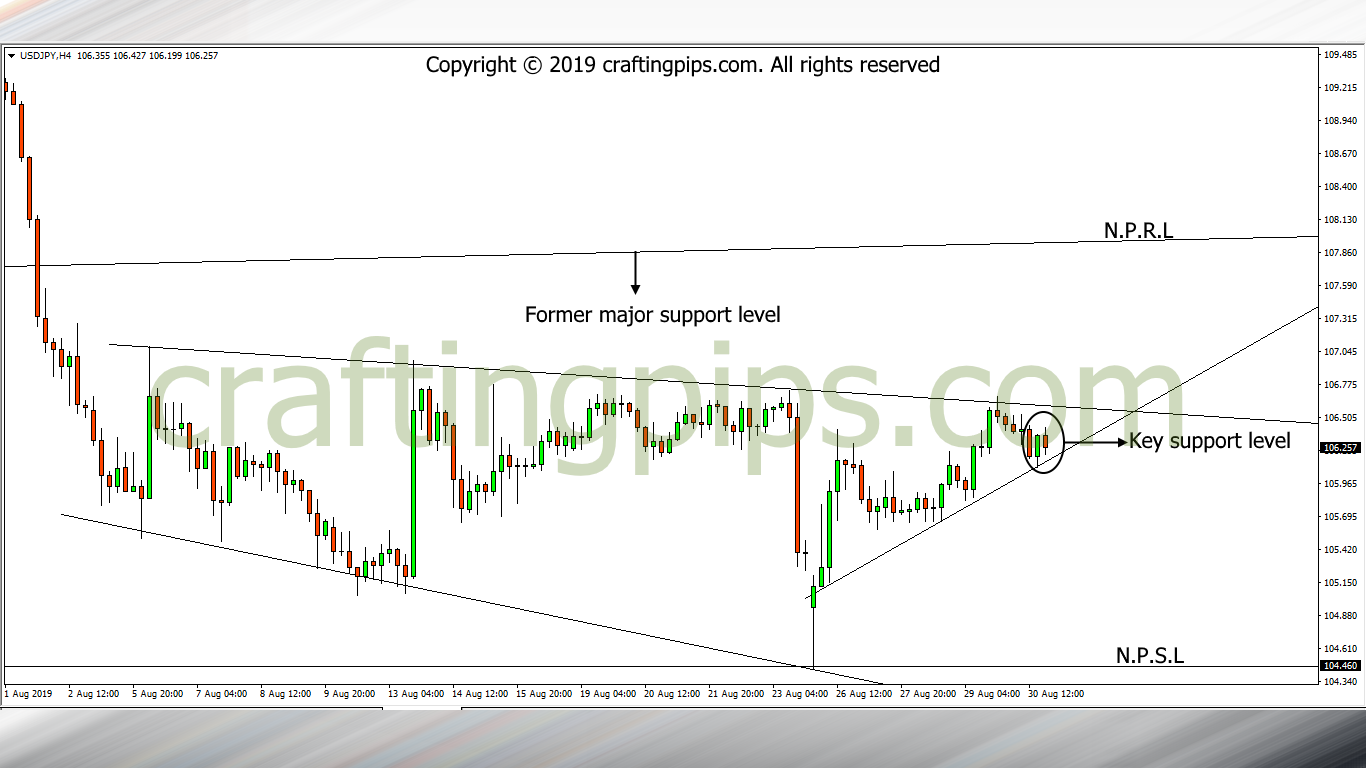
On the weekly chart of the USD/JPY, after price broke out through support level 107.907, we saw a consolidation of price around support level 104.720.
I am bullishly biased regarding this pair.
HOWEVER, we should also note that if we do not get a confirmation to go bullish, my bias is NOT VALID.
Confirmation for me would be price convincingly breaking through resistance level 106.606. If that happens, we should be looking at 108.202 as the next possible resistance level.
2. USD/CAD
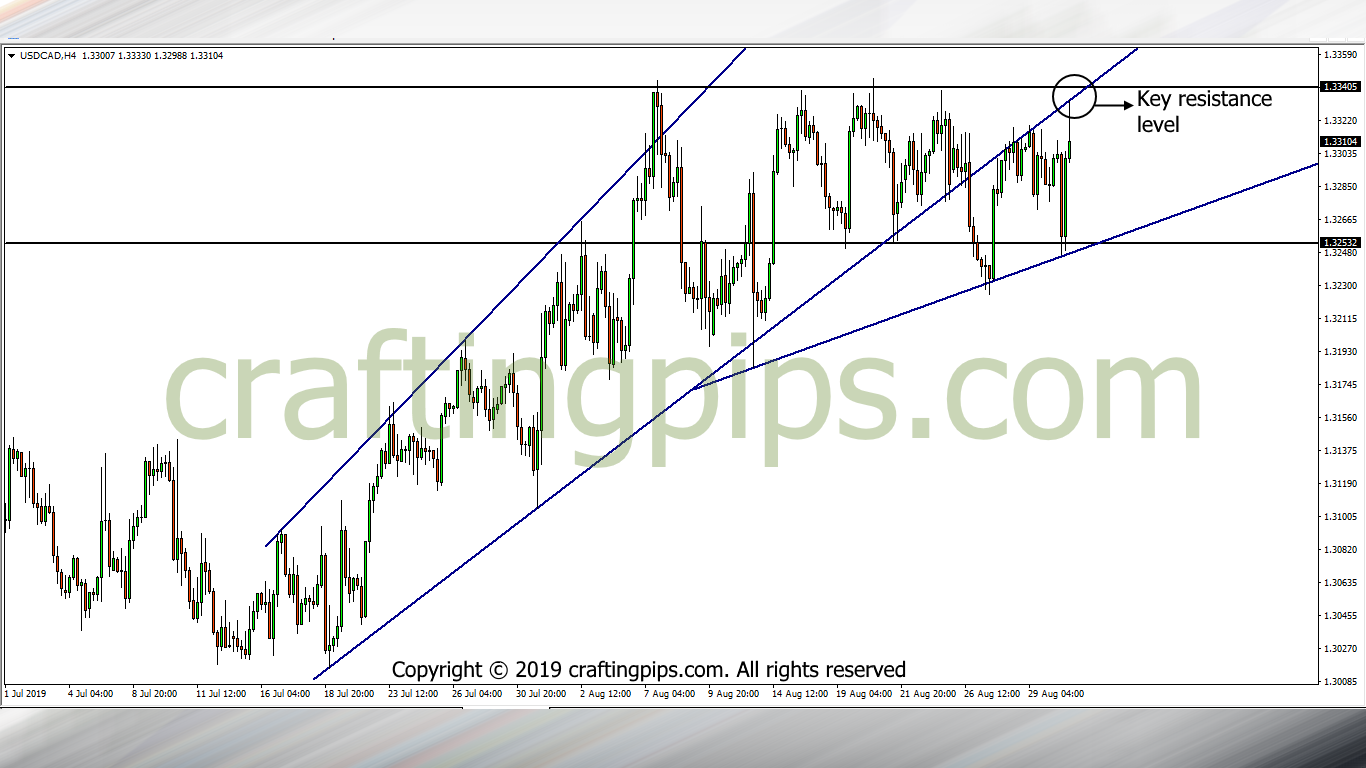
USD/CAD looks promising.
Since on the 7th of August, price has been rejected by resistance level 1.33405, and this has repeated itself four times now. This makes this resistance level as solid as a rock.
A breakout or reversal of price at the present resistance level will definitely send price to 1.34187(N.P.R.L) or 1.32532(N.P.S.L) respectively.
3. USD/CHF
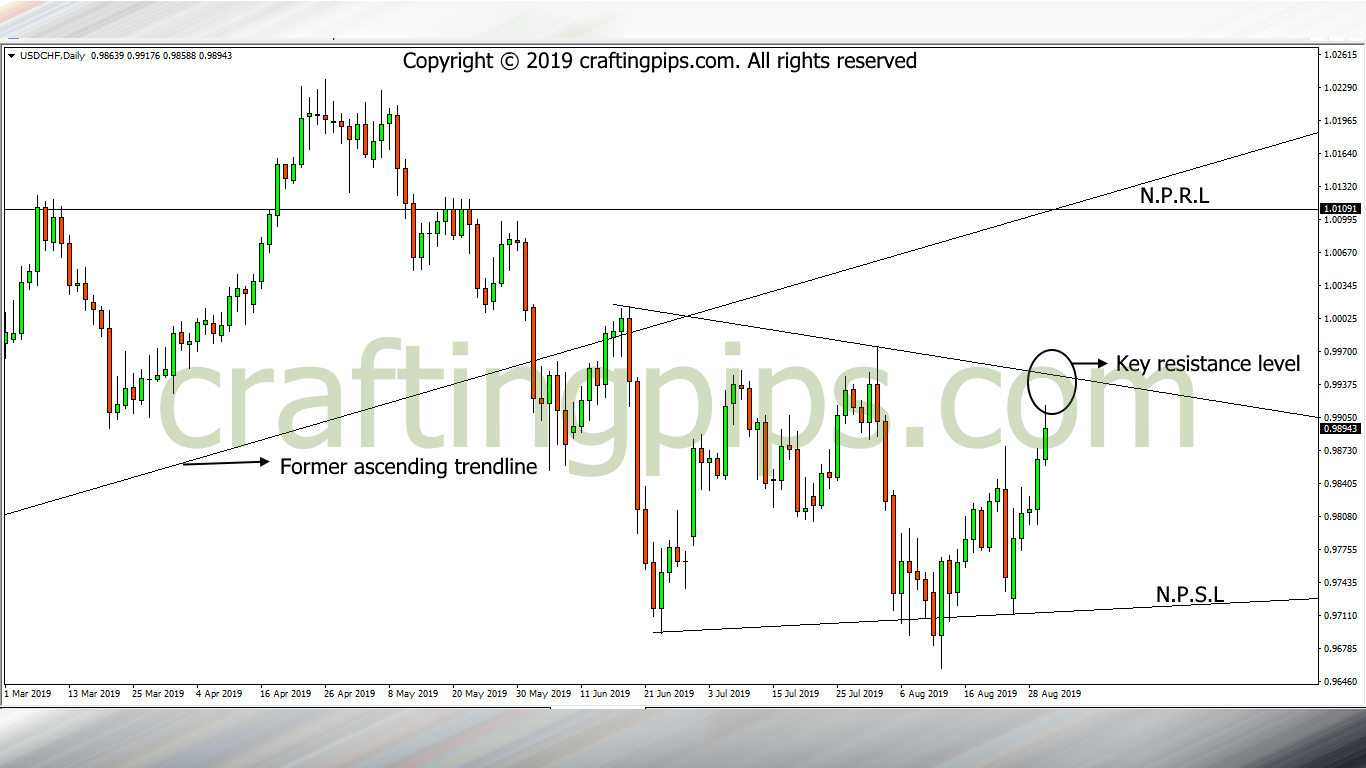
On the USD/CHF weekly chart, price broke through an ascending trendline’s support level (0.99747) on the 16th of June, afterward, there was a consolidation of price, hence forming a pennant.
On the daily time frame, we can clearly see that price is almost hitting resistance level 0.99499.
A reversal of price at resistance level 0.99499 should bounce price back to support level 0.97165 and a bullish breakout could encourage price to hit the next possible resistance level (1.00987).
I guess this week looks more like the battle of the U.S dollars.
Above are the major pairs, we will be tracking this coming week. However, there could also be a bunch of other viable setups we could be trailing during the week.
Stick around all through the week as we share daily updates on the market.
As always, stay pip-full
![]()
![]()
![]()
![]()
![]()
![]()