Hello traders,
it’s another beautiful week, lets see what the charts have for us.
1. USD/JPY
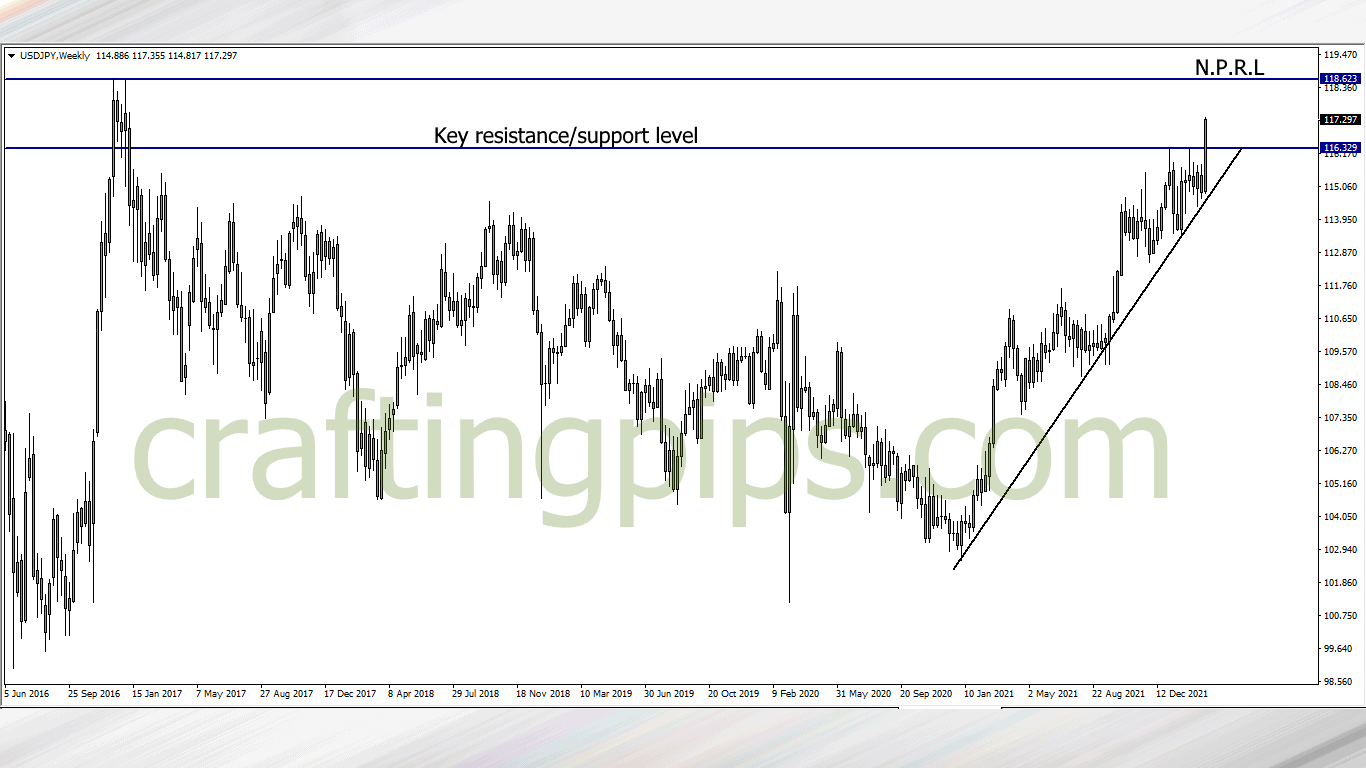
On the weekly chart of the USD/JPY we can see that resistance level 116.329 was broken last week.
The last time this happened was in December of 2016. This week we could see a minor or major pullback before price hits the next possible resistance level (118.623)
2. GBP/JPY
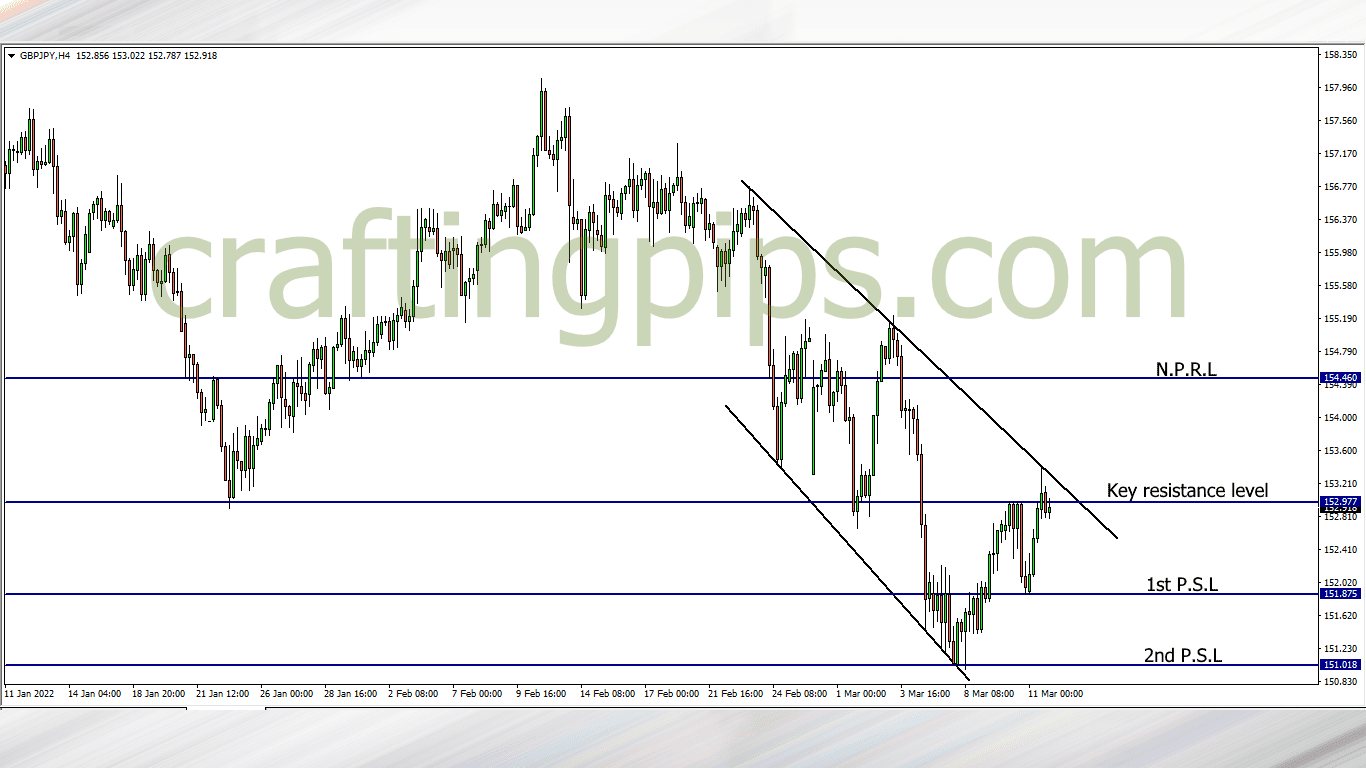
On the GBP/JPY, we can see price locked in a descending channel. Last week, price found it difficult to break through resistance level 153.399.
This week we may see a reversal which may take price back to support level 151.875. However, if we do get price break the resistance level (153.399.) of the descending channel, then resistance level 154.460 should be our next target.
3. NZD/JPY
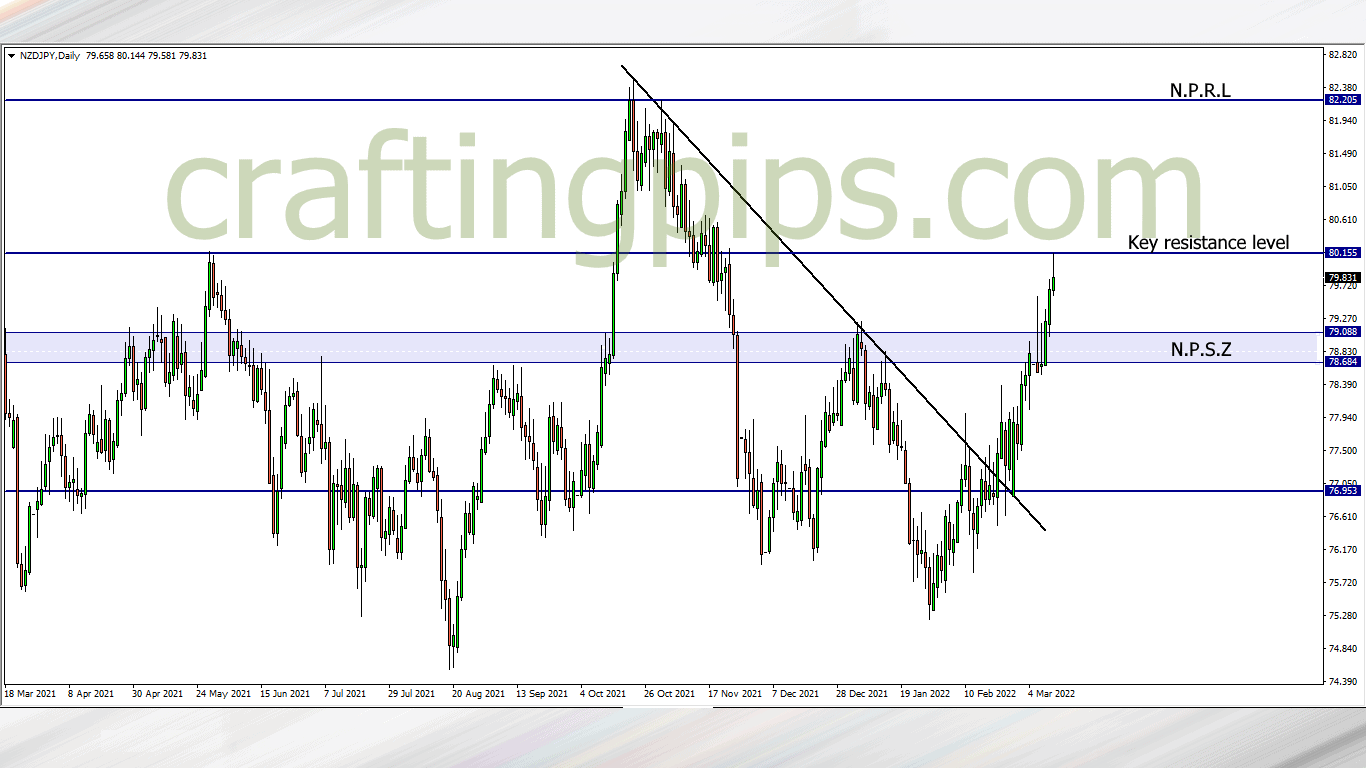
If price on the NZD/JPY is to continue its bullish move, resistance level 80.155 needs to be broken first.
There is a possibility that price may return to previous support zone (79.088-78.684) this week, but If the bulls break the present resistance level, price next move will be the next possible resistance level 82.205
4. AUD/USD
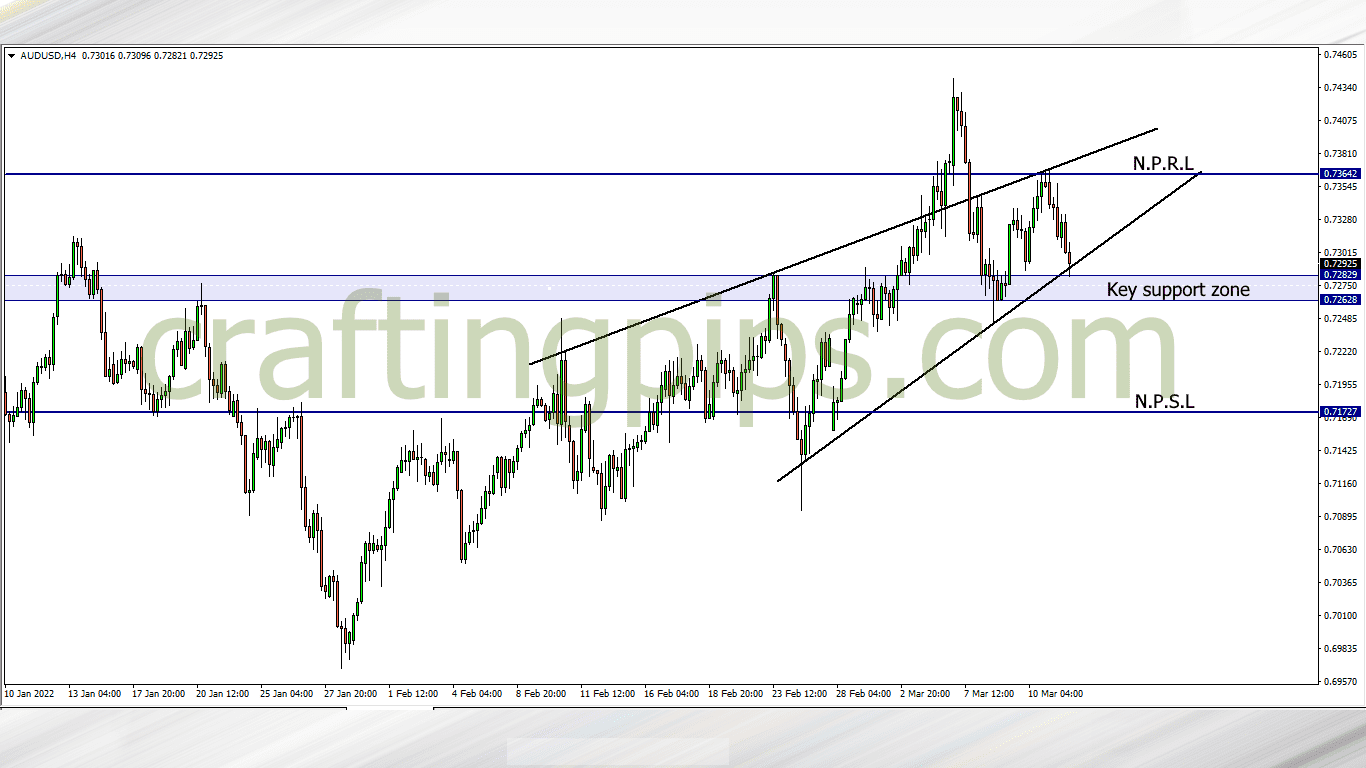
A narrowing ascending channel on the AUD/USD can be seen on the 4-hour time frame. Price is currently resting on a key support zone.
A breakout may encourage sellers to further drag price down to support level 0.71727. The week may also start with buyers giving us a good reversal entry, and if that happens, we may see price return to resistance level 0.73642.
What say you?
Traders who are interested in joining our FREE trading group on Telegram, where trade ideas and trade-related topics are discussed, which could assist your trading career while being infected by positive vibes
hit us on Pip Crafters