Hello traders,
its a brand new week and a brand new month, let’s see what the market has for us
1. GBP/USD
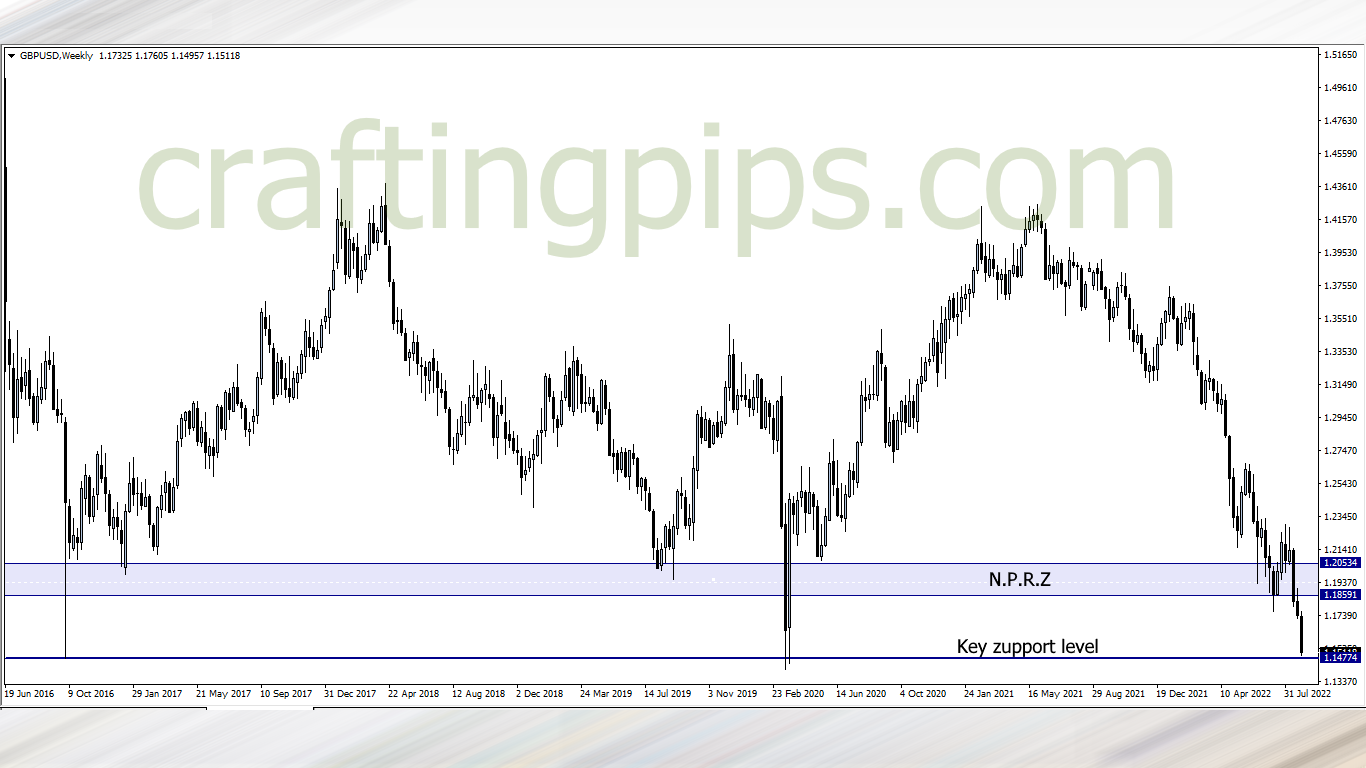
Triple bottom on the weekly chart of the GBP/USD. The bears came in hard last week, but there is a huge possibility that the 5 years plus old support level (14774) will hold price again for the third time
If that happens, price may revisit the previous resistance zone painted blue. However if the current support level fails to hold price, we may see the GBP/USD slip to its lowest point since 1999.
2. USD/JPY
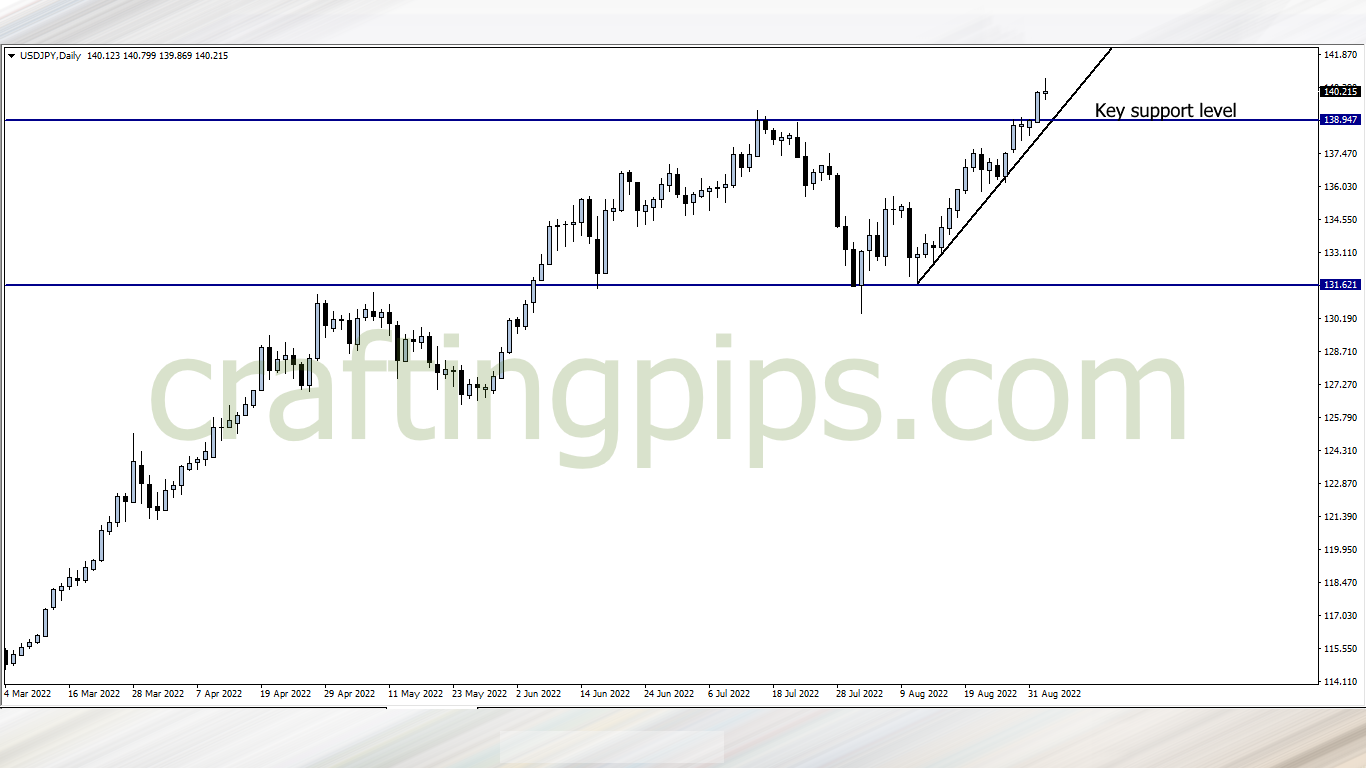
Last week on the USD/JPY, a new high was formed after resistance level 138.947 was broken. In this month of September, we may see an over 400 pips move to the next possible resistance level (144.672)
3. USD/CHF
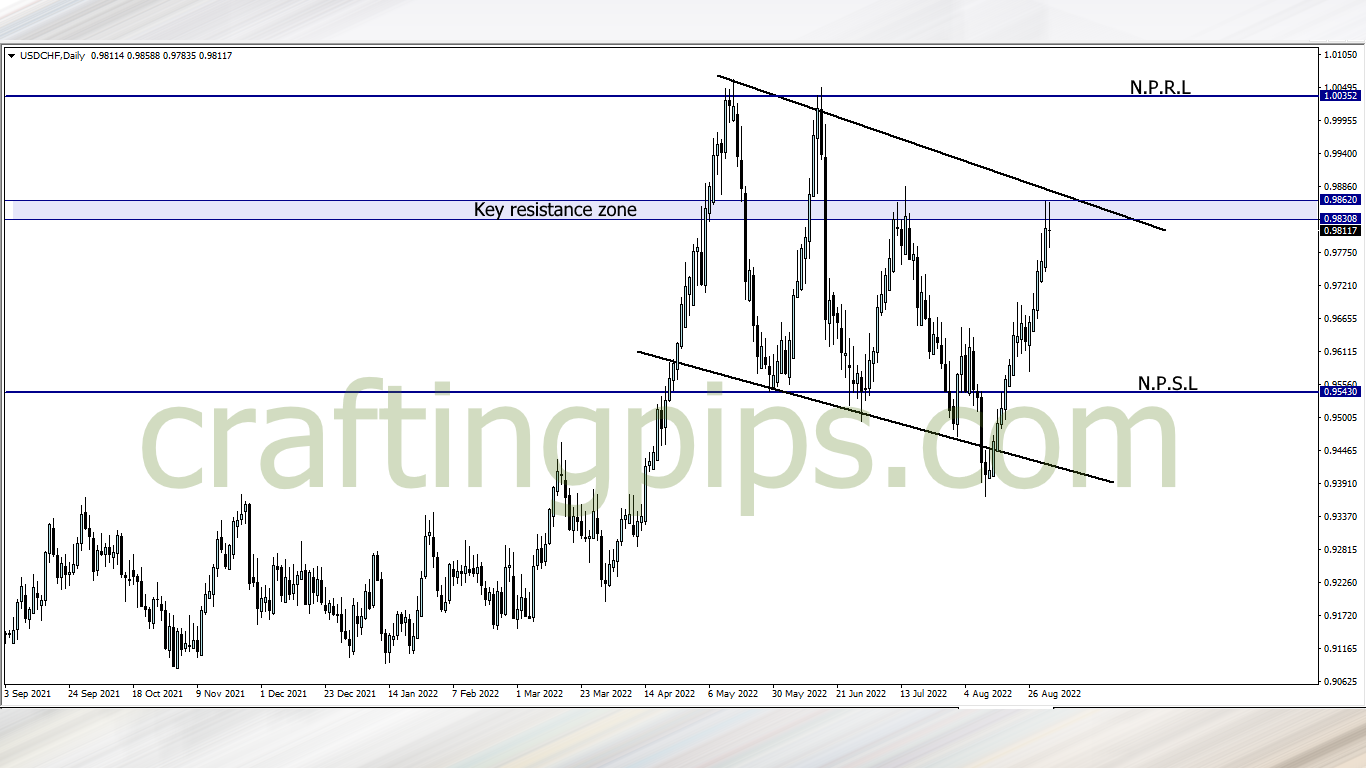
A beautiful descending channel can be spotted on the USD/CHF.
Price is currently hooked on a key resistance zone. If we do get a breakout through the key resistance zone and the descending trendline serving as a resistance level, the bulls next target will most likely be 1.00352
There is also a possibility of a reversal at the present key resistance zone. If the bears win, then price may most likely revisit support level 0.95430
4. XAU/USD
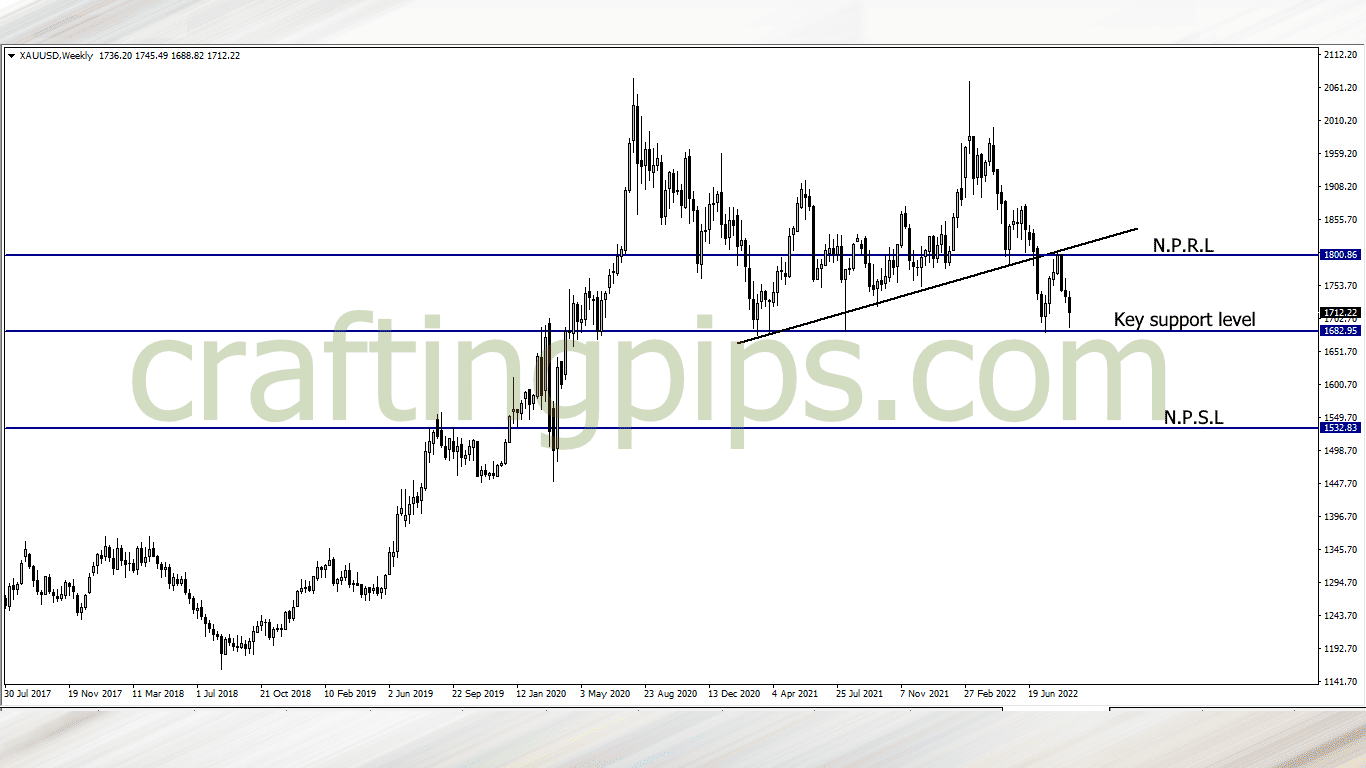
Gold is looking good this week.
Support level 1682.95 is holding price from falling for the fourth time in 18 months. Are we going to see price return to the previous resistance level (1800.86)? or
Are we going to see the sellers dominate the market this month and drag price down to support level 1532.83?
What say you?
Traders who are interested in joining our FREE trading group on Telegram, where trade ideas and trade-related topics are discussed, which could assist your trading career while being infected by positive vibes
hit us on Pip Crafters