Hello traders,
let’s see what the market has for us this week:
1. GBP/USD
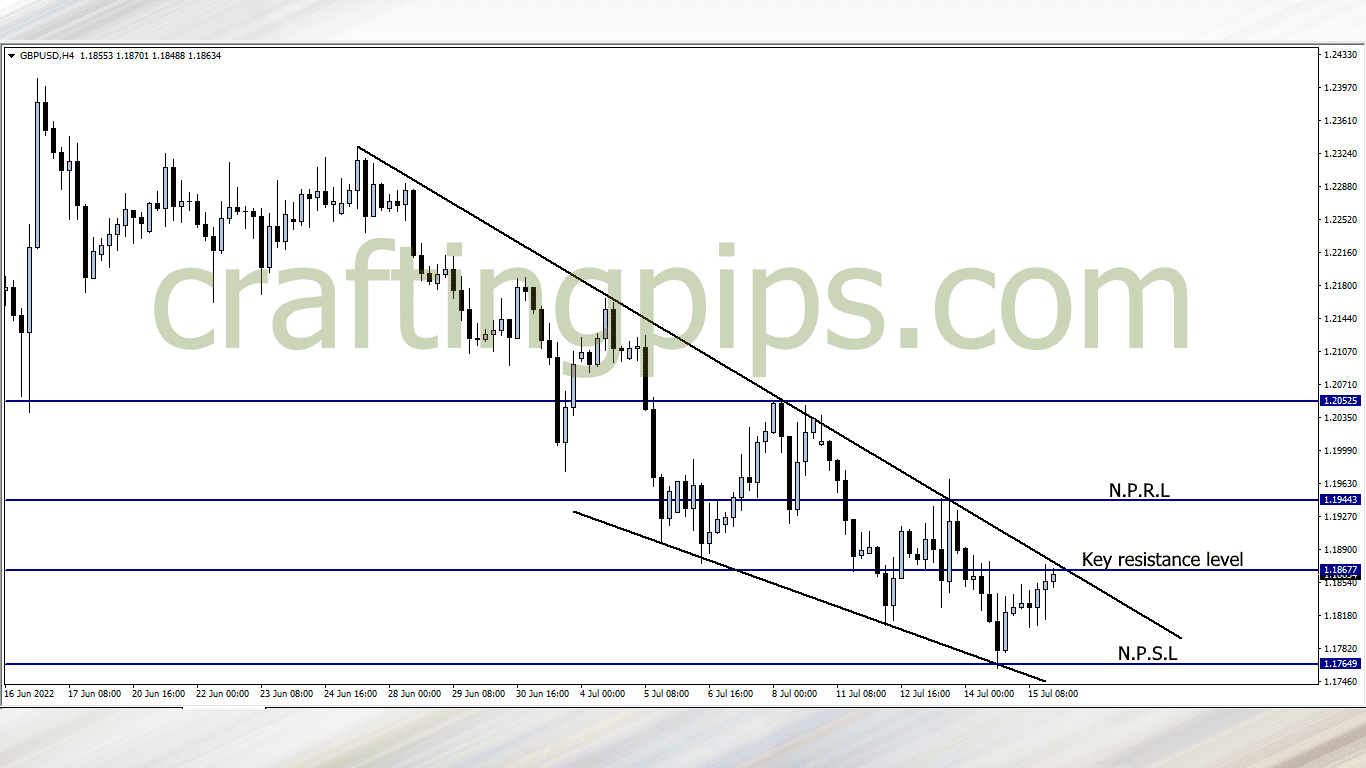
A beautiful narrowing descending trendline can be spotted on the GBP/USD.
Last week closed with price questioning resistance level 1.18677. All we should be looking out for this week is how price reacts to the present level.
A breakout means price next possible resistance level would be 1.19443, and a reversal at this point will mean price may most likely re-visit support level 1.17649
2. USD/JPY
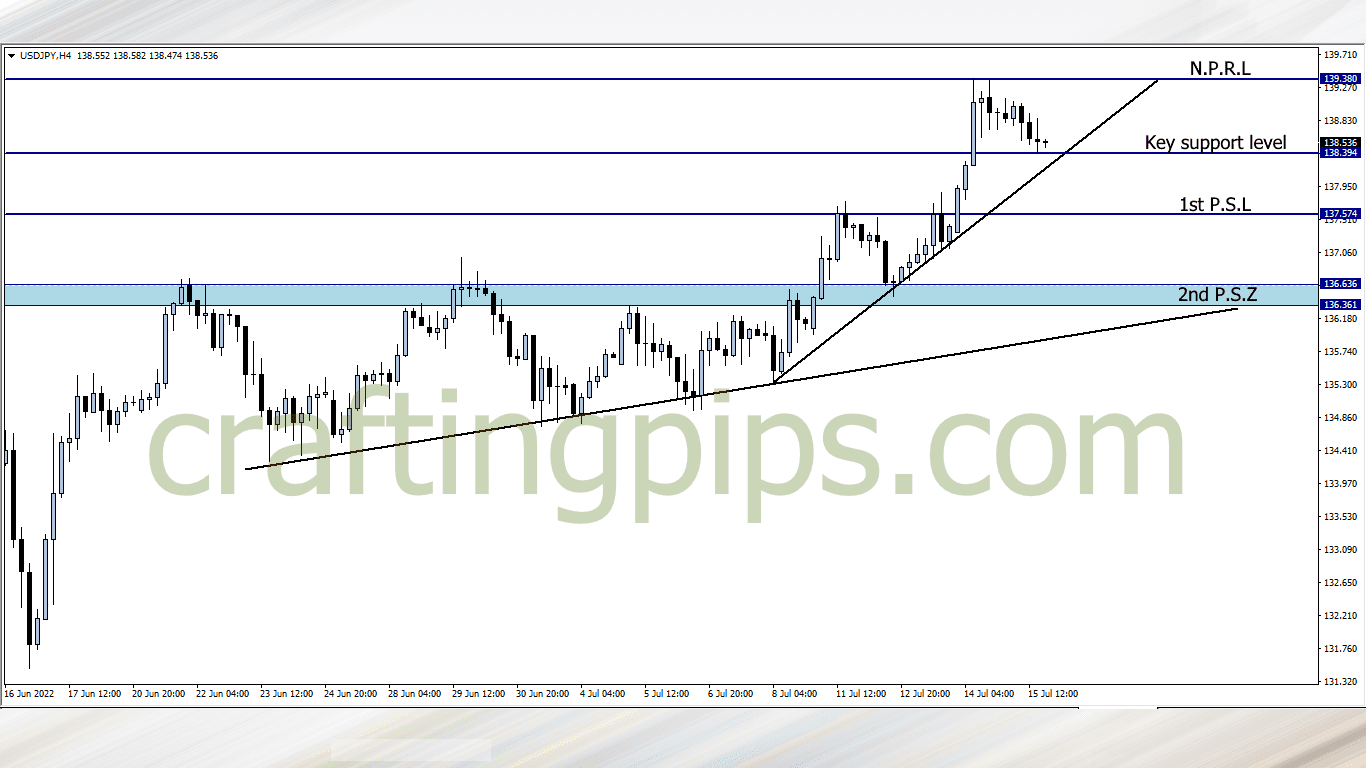
USD/JPY has been creating new resistance levels since it broke through the resistance zone in the first week of July.
Last week closed with price giving us a pullback after resistance level 139.380 was created. This week there is a possibility that we may see price bounce off the current support level to revisit resistance level 139.380.
We could also see the current support level (138.394) get degraded by the bears and price revisiting support level 137.574
3. EUR/JPY
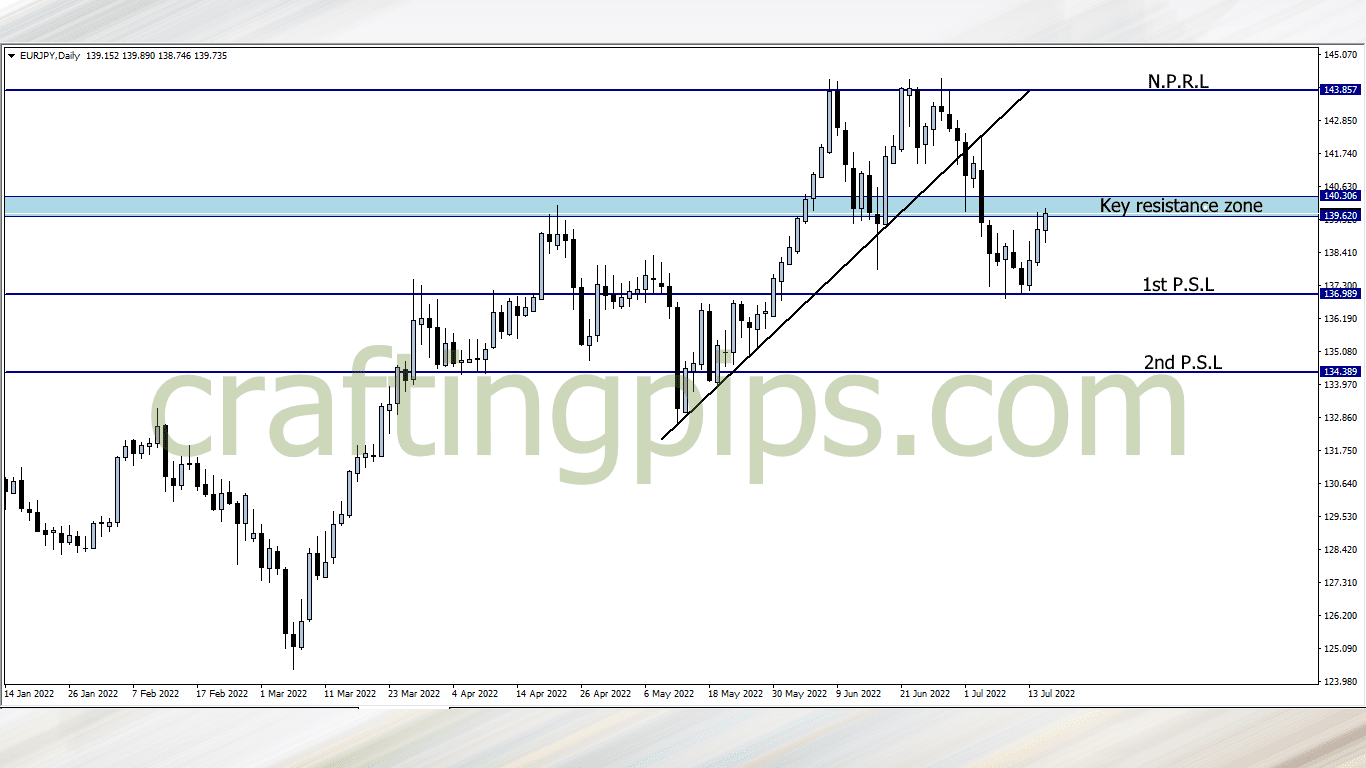
Price turned bullish after hitting support level 136.989 on the EUR/JPY.
If we are to buy into the bullish power that started last week Wednesday, then we will have to see the key resistance zone get broken first. If that happens, our focus will be joining the buyers to the next possible resistance level (143.857)
If Monday’s daily candlestick closes weak, and gives us a hint that the key resistance zone is too much for the bulls to handle, then we will be looking for additional bearish confirmations, and most likely ride the wave with the bears to last’s week’s support level (136.989)
4. NZD/USD
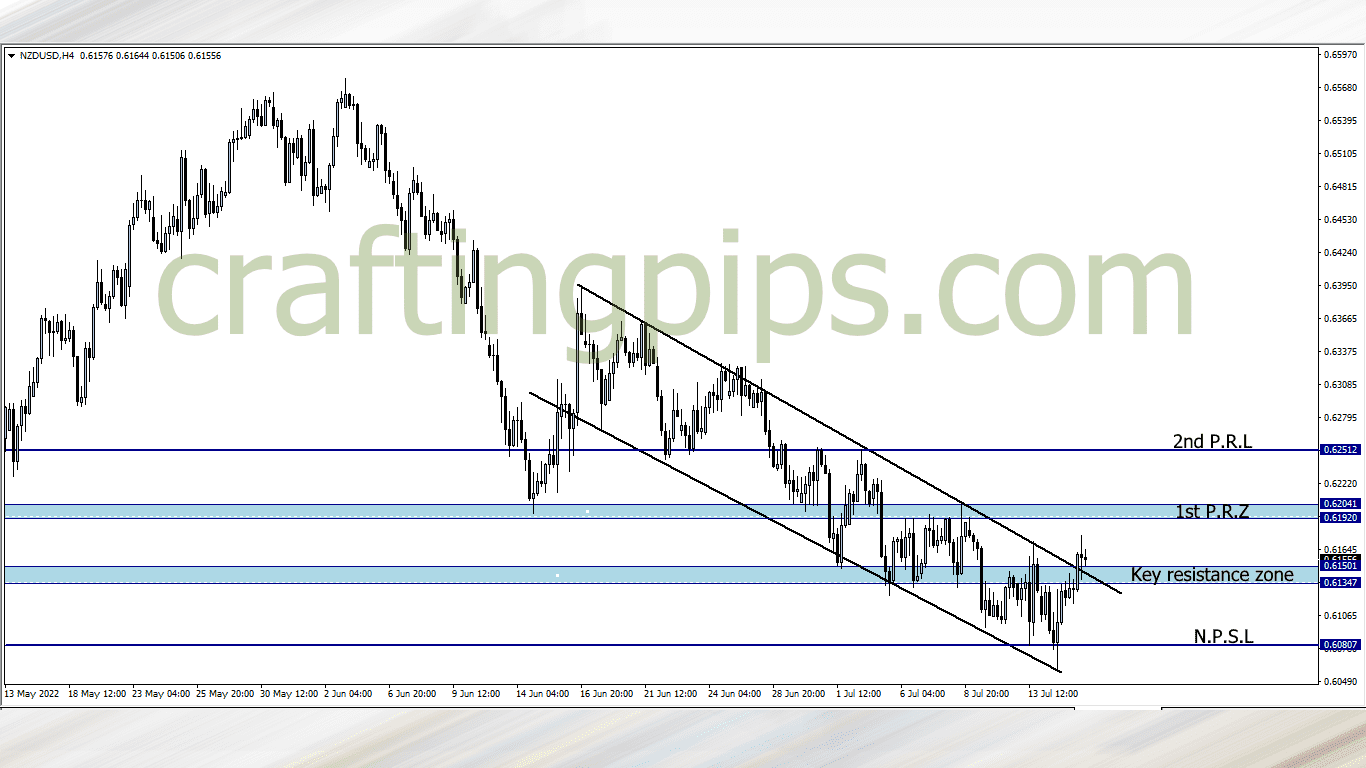
Last week closed with price breaking the roof of a month old descending channel.
If the bulls pick up where they left off last week, then our next target would be 0.61920-0.62041, and if the bulls break this zone, then our next target or resistance level would be 0.62512
However if we resume the week and the bulls are absent, we may see the previous resistance zone which is now a support zone get broken and price returning to support level 0.60807
5. EUR/NZD
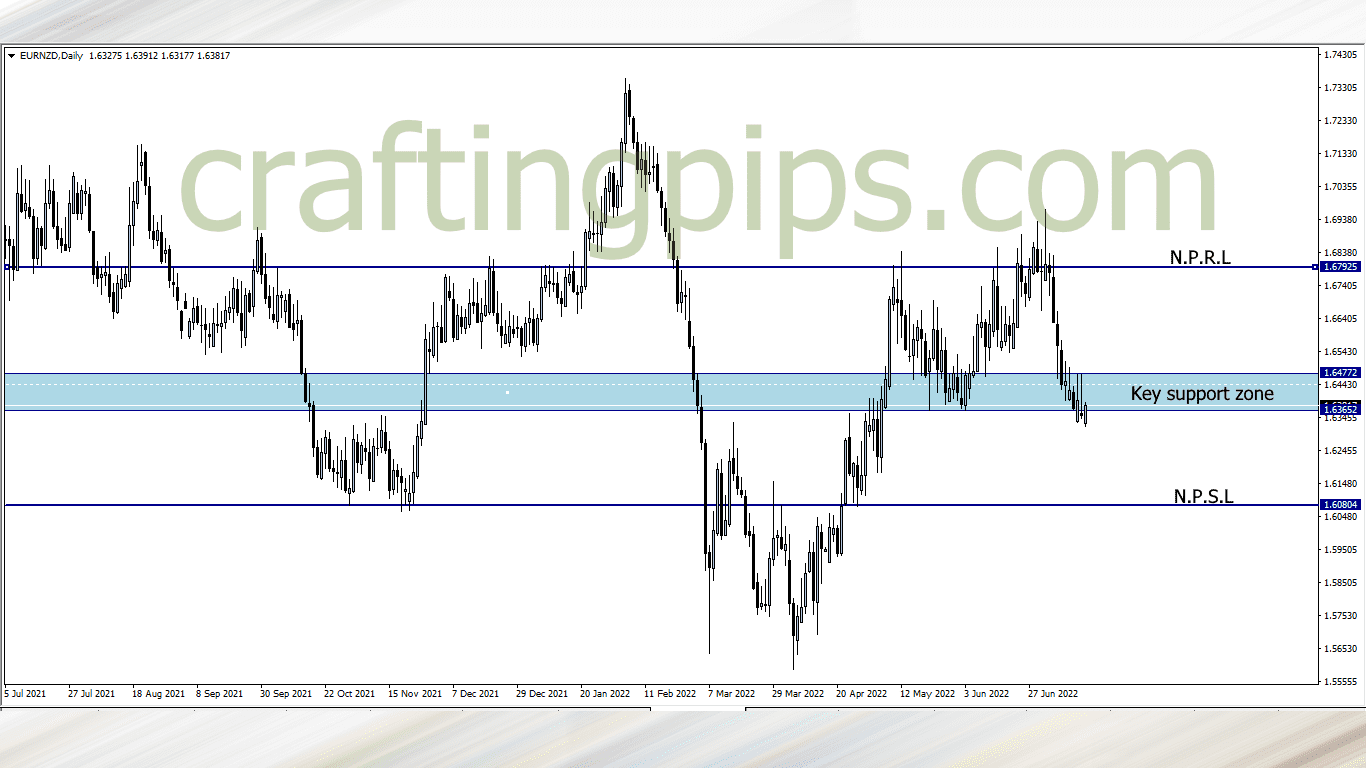
A partial breakout on the EUR/NZD can be seen.
Remember its a daily time frame and we would need a close of Monday’s daily candlestick before we can fully understand if this partial breakout from last week means us selling this pairs and eyeing support level 1.60804 as the next possible support level, or
If we are just seeing a fake out, and price reversing at the current level, and heading back to resistance level 1.67925, which is highly unlikely, but not impossible.
6. NZD/JPY
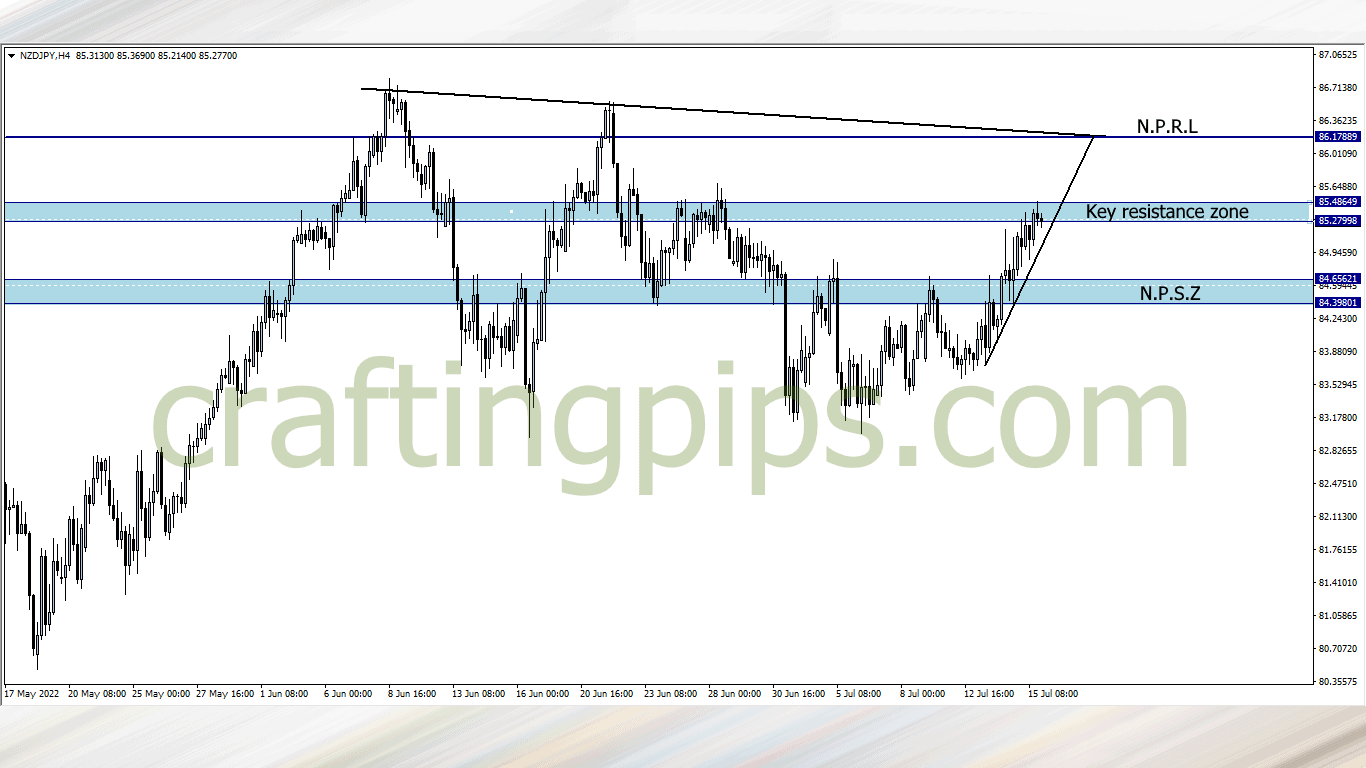
NZD/JPY spent the most part of last week being bullish, and also leaning on a steep ascending trendline which has served as a key support level.
The key resistance zone will serve as a big test this week. A breakout will mean price possibly splurging over 60 pips as it hits the next key resistance level (86.17889)
However, if the ascending trendline fails and we spot a reversal, then price may most likely return to a a key support zone.
What say you?
Traders who are interested in joining our FREE trading group on Telegram, where trade ideas and trade-related topics are discussed, which could assist your trading career while being infected by positive vibes
hit us on Pip Crafters