Good day traders,
I hope everyone is safe out there?
I am positive we are going to subdue Covid-19 sooner than later. Let’s hang in there, help one another in every possible way we can and continue to remain positive.
How was trading for you last week?
There were some great moves in the market on Friday (Though I rarely trade on Fridays) which I missed out on, but it’s all good.
The summary of how trading went down for me last week was:
Tweet

I took both trades at the beginning of the trading week (Monday), and at the end of the week, just the GBP/CHF did well.
The EUR/CHF was just stalling a particular level all through the week.
So, let’s see what this new week has got for us. Put on your helmets, pick up your guns and let’s hit the market.
1. GBP/USD
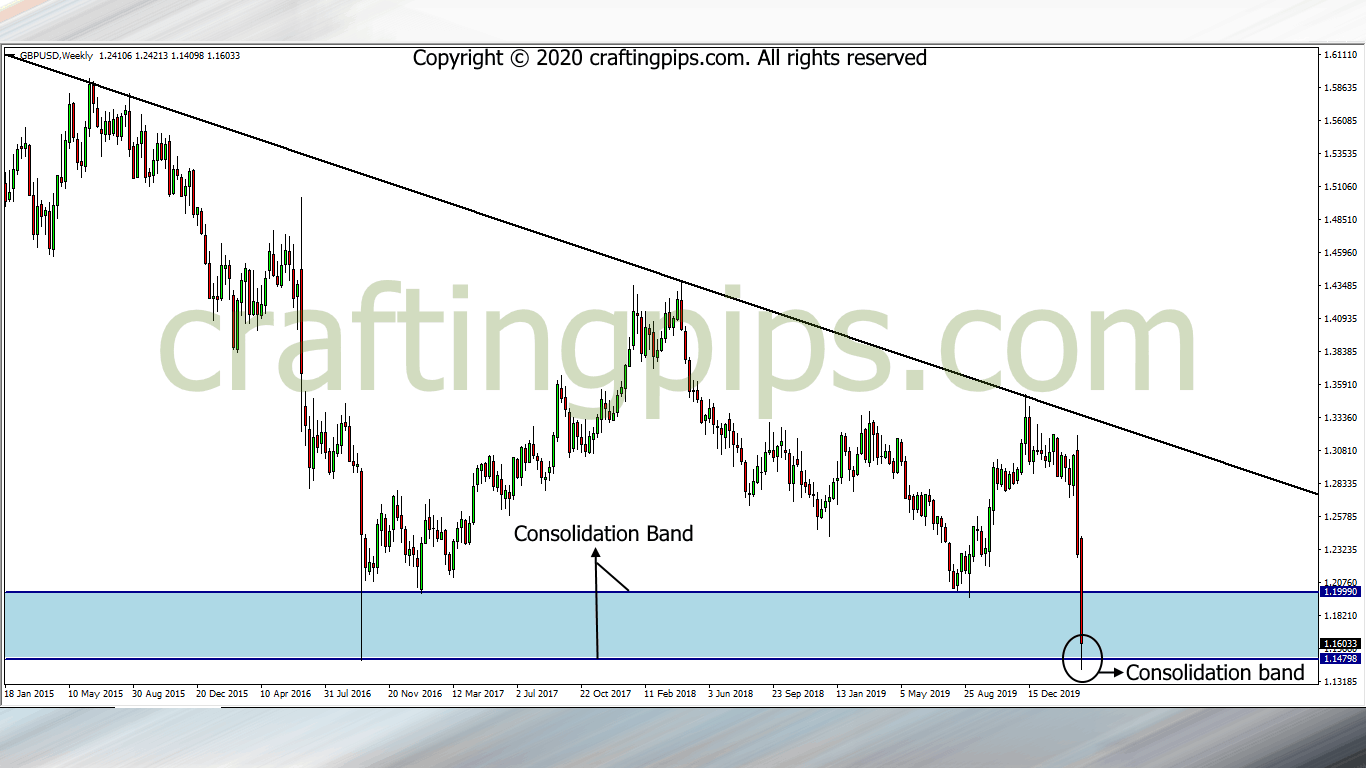
GBP/USD on the weekly chart has fallen and spewed over 1,600 pips in the last 2 weeks.
This has made price hit the lowest point in the market (1.14609) since 2016.
My thoughts are:
Are we going to see GBP/USD fall some more, or consolidate within the consolidation band?
We just have to wait and see what price will reveal to us this week.
If the 1.14609 support level breaks, we could see price tumble down another 250 to 500 pips. We could also see price just consolidate within the 1.19903 and 1.14609 level (consolidation band) this week.
2. GBP/JPY
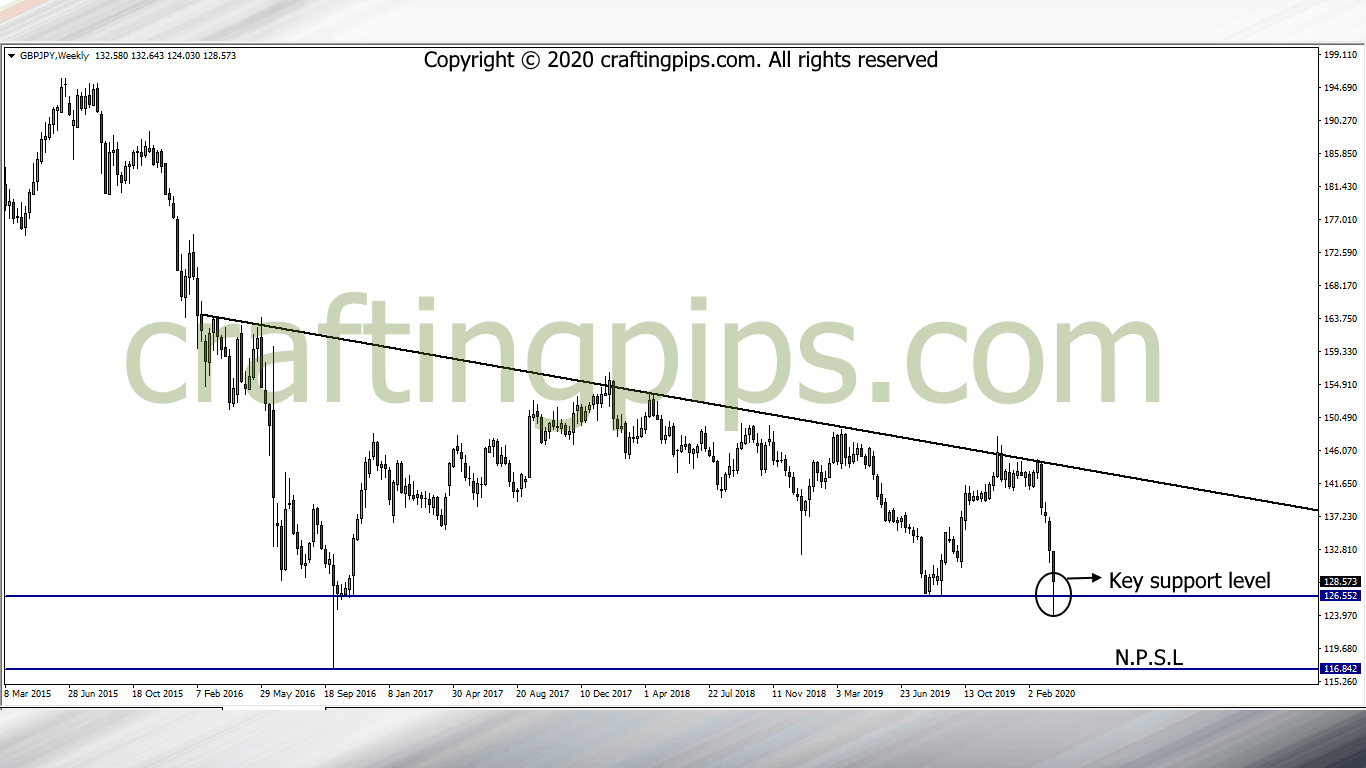 GBP/JPY gave us a fake breakout on Wednesday.
Afterward, the pair spent the rest of the week gradually retracing its steps over 700 pips after the breakout.
Looking at the weekly chart, my opinion is that there is a possibility that price may revisit support level 126.552.
If the support level is broken again for the second time, we may need to start looking out for a sell confirmation.
If NOT, price may continue another 650 pips move to the next possible resistance level (135.351).
3. USD/CAD
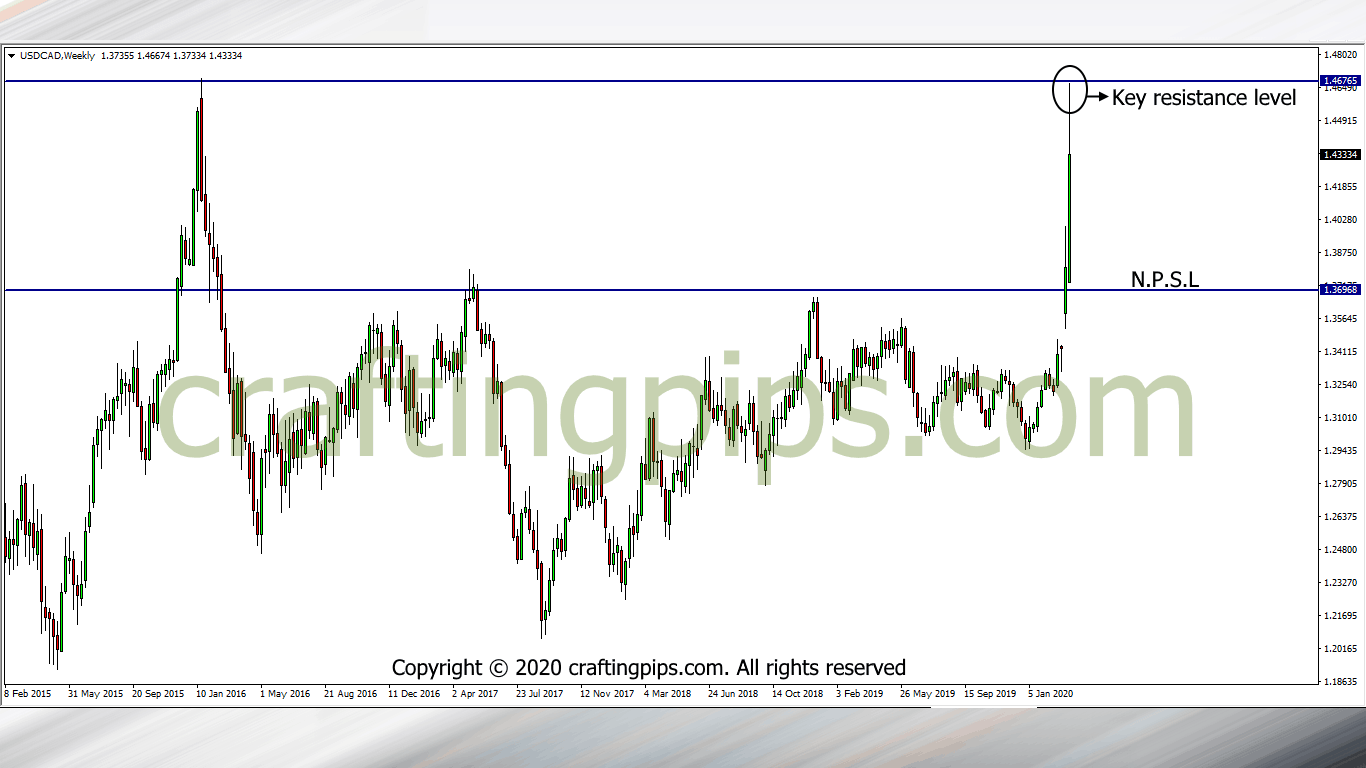
The last time we saw USD/CAD hit the present resistance level(1.46684) was 2016.
On the weekly chart, price lost some steam (Over 300 pips) after hitting this key level.
Personally, my bias is bearish on this one… but, hollup, hollup, hollup.
My bias is not a confirmation fam.
Let’s see how price reacts as soon as the market resumes.
If we are right, then our next possible support level would be 1.36711.
However, if the Bulls continue to do their thing, price could reach a new resistance level (1.58403)
4. USD/JPY
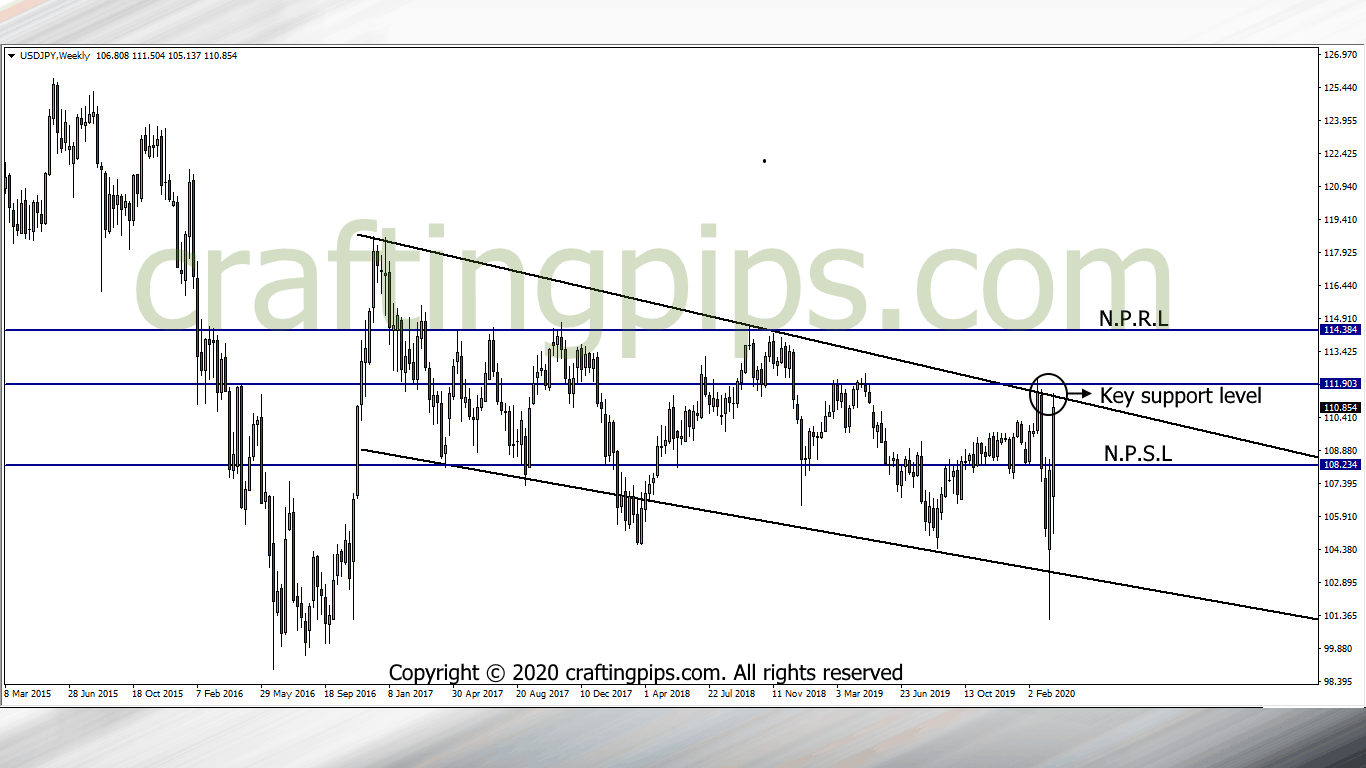
USD/JPY has moved over 1000 pips in the last 2 weeks and only stopped when hitting resistance level 111.410. In the process, our descending channel still managed to remain intact at the close of the week.
On the daily chart, we can see a beautiful Doji signifying that the market closed with most buyers taking a breather.
Is this enough to give us a sell signal?
NO, NO, NO…
In my opinion, the USD/JPY is still highly bullish, the doji on the lower time frame and the resistance level presently holding price could be annihilated if the buyers return to the market this week.
We would need an additional confirmation before going either direction.
If a reversal is confirmed this week, price could re-visit support level 108.027 and if the 112.058 conservative resistance level is broken, then there is a huge possibility that price may hit resistance level 114.435.
In all of this, we must remember to exercise great caution, a sound money management system and the patience of a vulture before taking of these setups.
Thank you for sparing your valuable time with us, your comments will also be appreciated.
Do have a pip-full week ahead folks.