Hello Legendary Traders,
Another new week is upon us and it’s paramount we go through our charts in order to mark all the Kill Zones we should be watching out for. It makes the week less stressful when you come to the market prepared.
Pardon me for being rude… How did your weekend go?
Mine was restful and also entertaining.
That said, grab your binoculars, let’s hit the forex forest.
1. GBP/USD
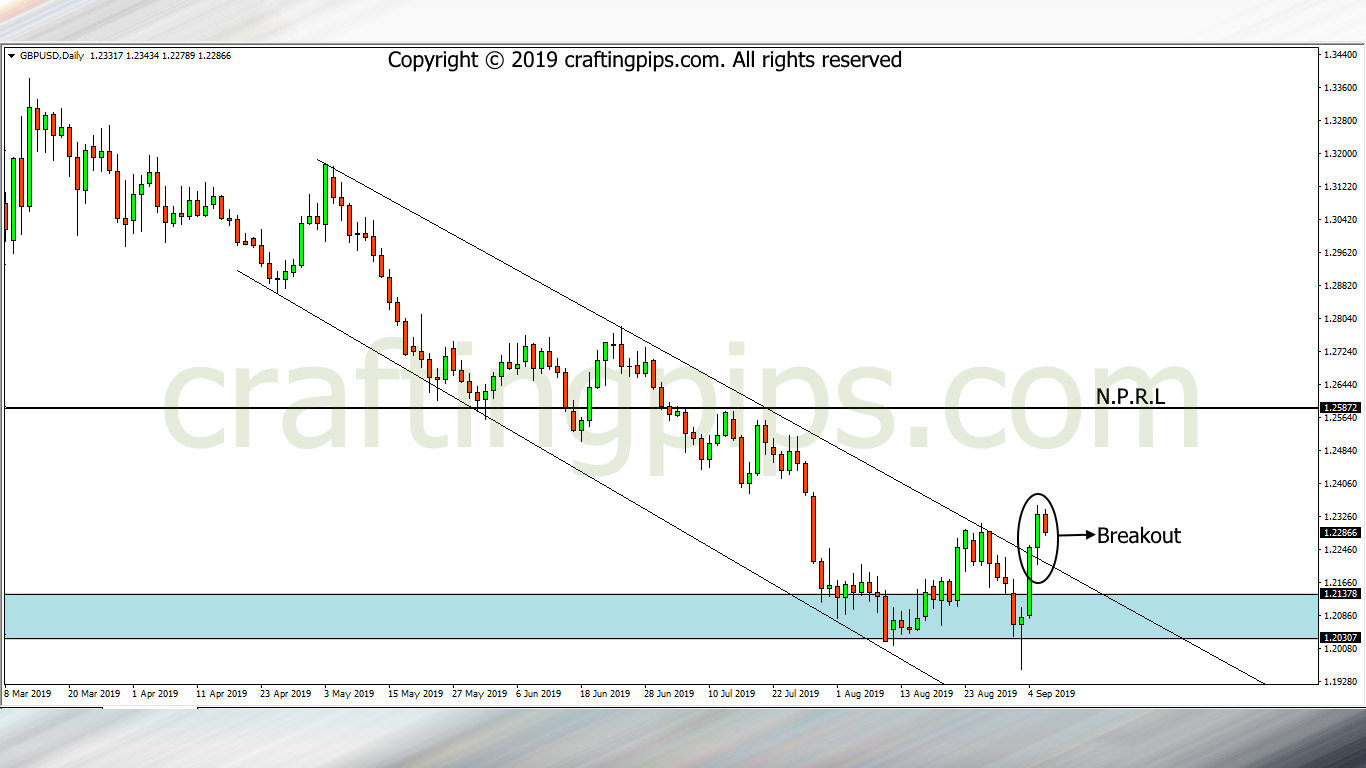
On Friday we saw the GBP/USD on the daily chart, close with a slight pullback after the breakout of the 1.22303 resistance level.
We should be mindful that Monday’s are unpredictable in the market, and though I am bullish biased, I would still have to wait for the cloud to clear before taking this trade.
If the Pounds sterling still continues with its strength over the U.S dollar this week, we should see price hit 1.25872 as the next resistance level.
2. GBP/JPY
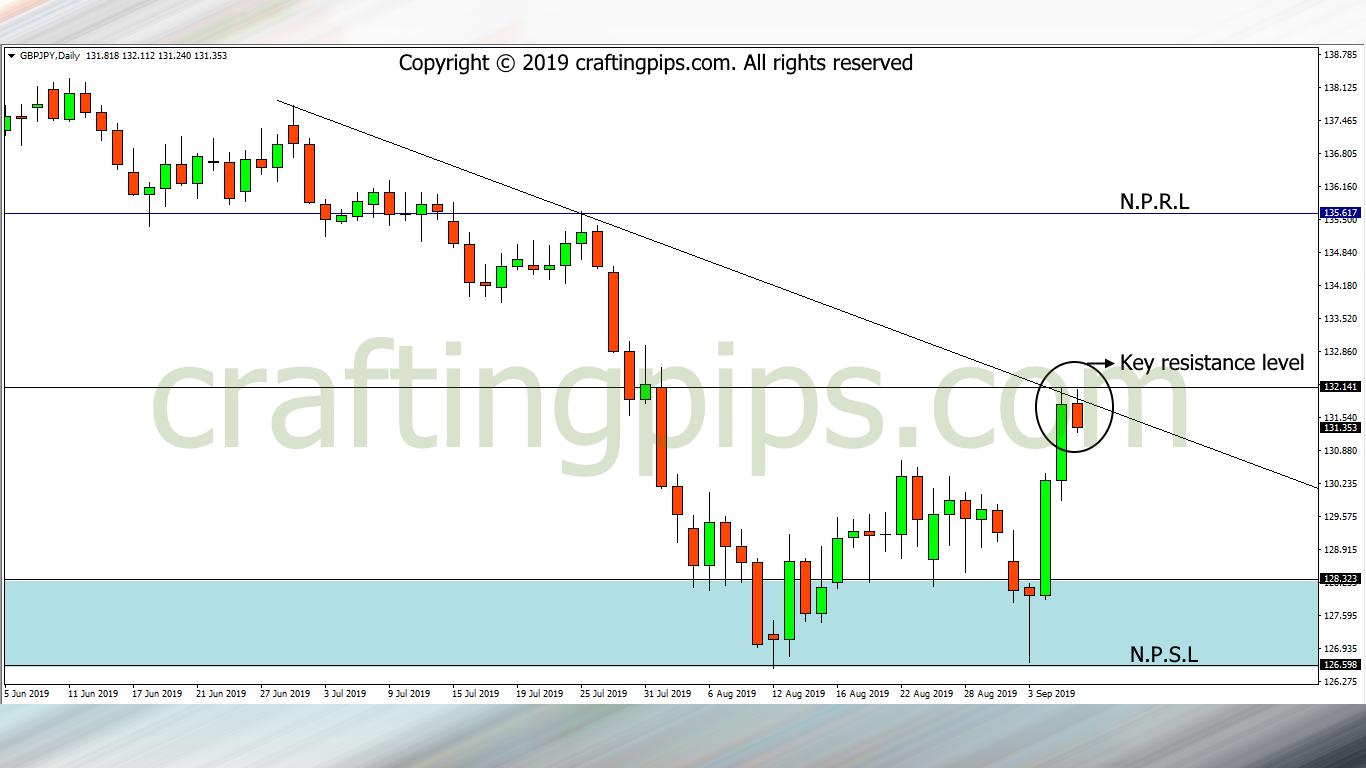
GBP/JPY on the daily chart closed trying to break out from a key resistance level 132.141
On the weekly chart you will see that price on the GBP/JPY bounced off a key support level (126.598)
I believe the only thing holding price from hitting the next possible resistance level (135.617) is the present resistance level on the daily chart.
Mind you, there is also a slight possibility for a reversal of price to occur, and if price should reverse, we could be looking at the revisit of price level 126.598.
3. EUR/JPY
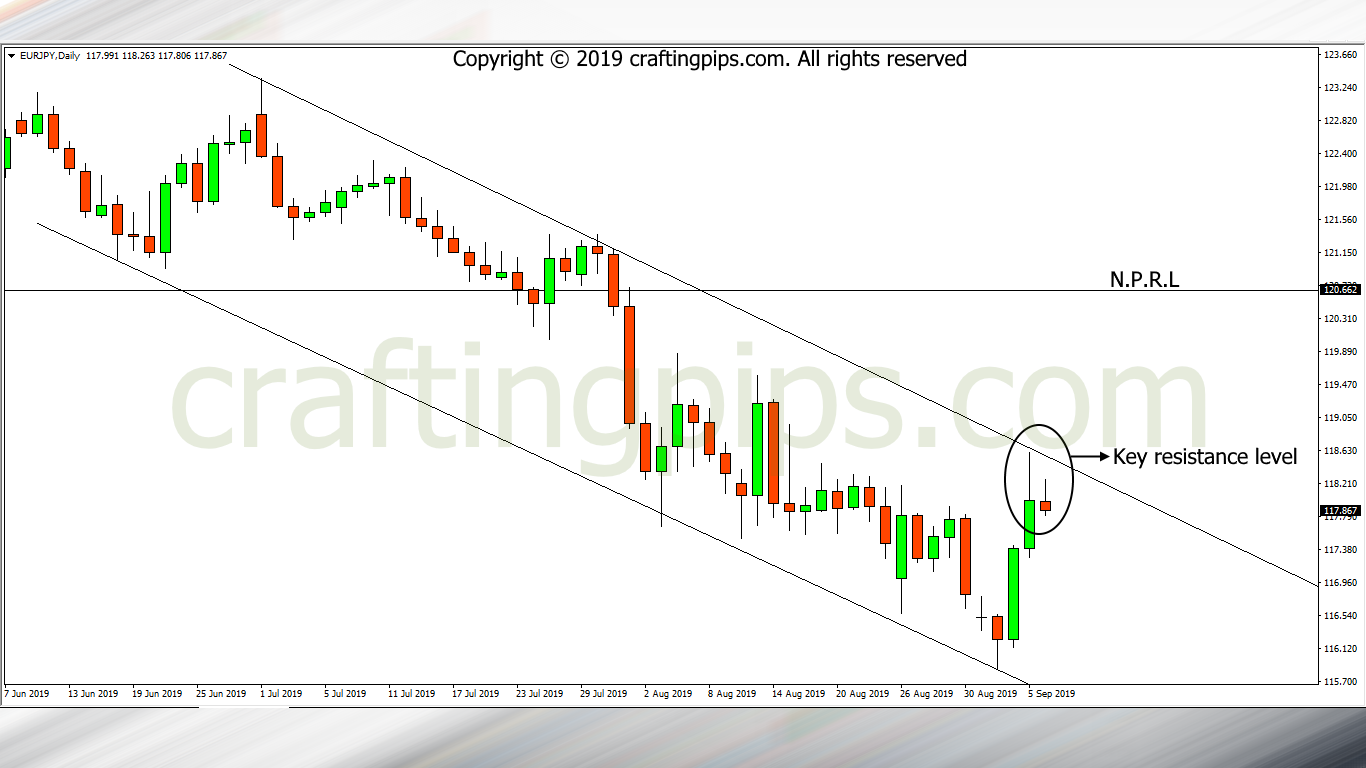
On the daily time frame, we can see price lurking around resistance level 118.622.
Judging the importance of the support level (115.927) price bounced off from, there is a huge possibility that we may see a breakout of resistance level 118.622 this week.
If the breakout occurs, price next possible resistance level would be 120.662 on the other hand, we cannot rule out a reversal of price to a previous support level (115.927).
4. NZD/USD
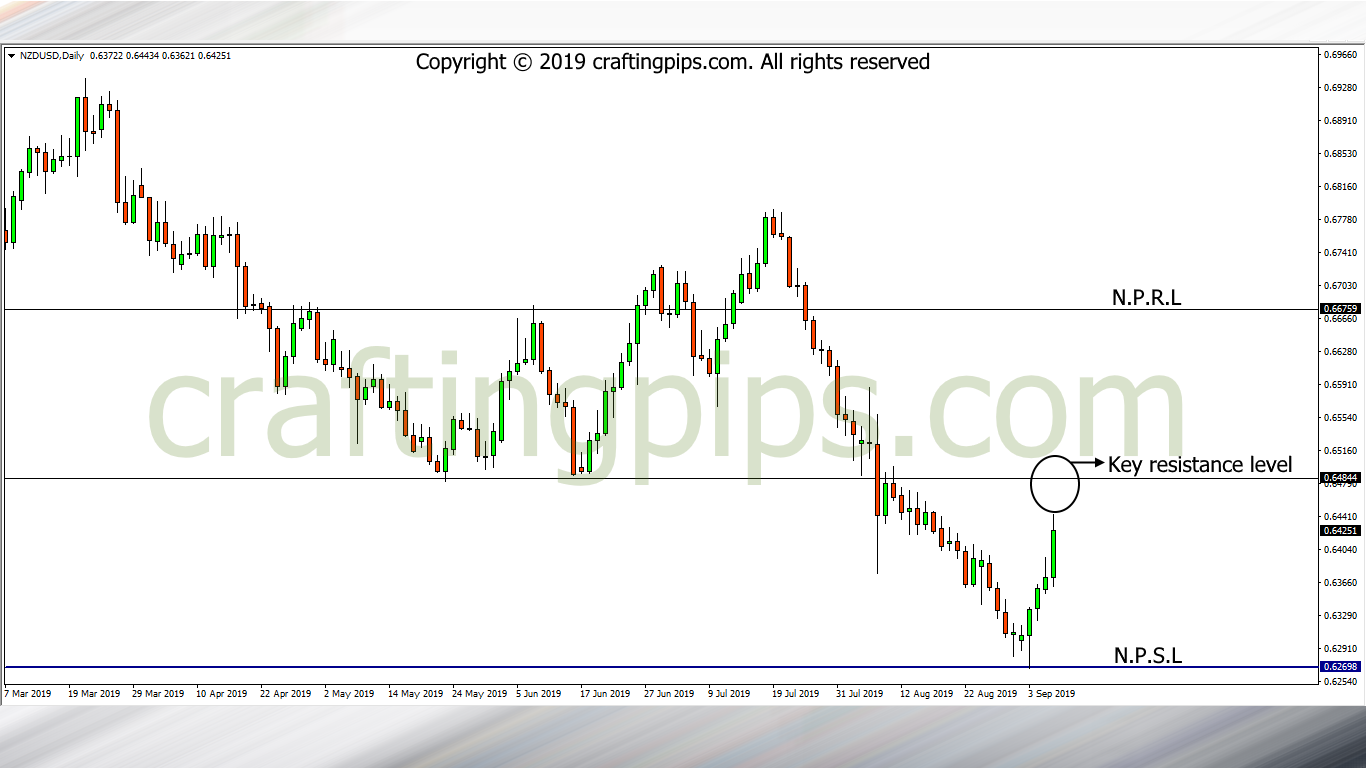
NZD/USD is approaching a key resistance level (0.64844)
On this pair, I believe it would not be out of place to fold our hands and wait for price to reach resistance level 0.64844, after which we monitor for breakout or a reversal.
A breakout should lead price to the next possible resistance level (0.66759) and a reversal should pull price back to support level 0.62698.
We are done with our weekly analysis, but we will continue to analyze the market all through the week, so do stick with us and if you are interested in making inquiries about the services we render, you could reach us through any of our social media outlets.
I wish you a productive week ahead
![]()
![]()
![]()
![]()
![]()
![]()