Hello traders,
let’s see what the charts have for us this week.
1. GBP/USD

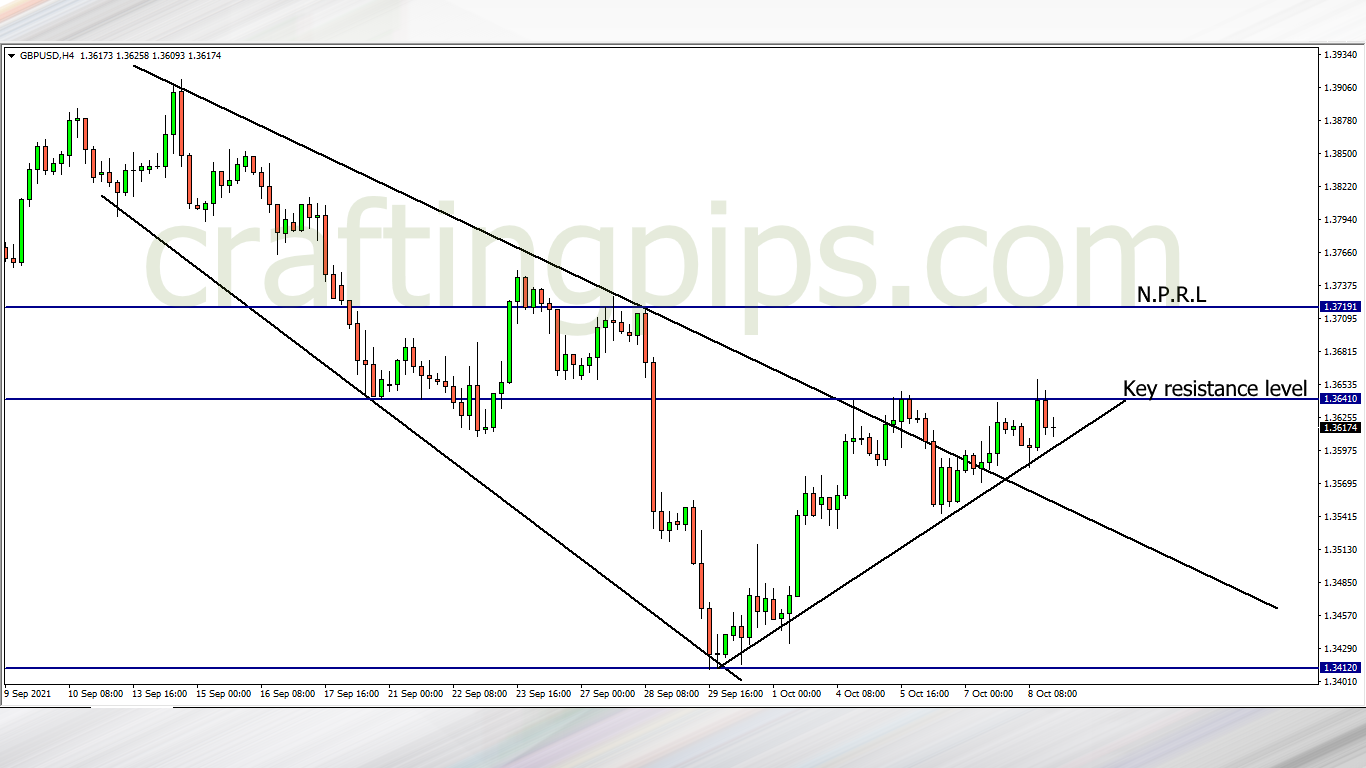
The GBP/USD closed the week trying hard to break the 1.36410 resistance level, but all attempts failed. Instead, we can see higher lows formed by price.
The higher lows formed is a clue that the bulls may come in strong this week. If that happens, we may see price visit the next possible resistance level (1.37191)
2. GBP/JPY

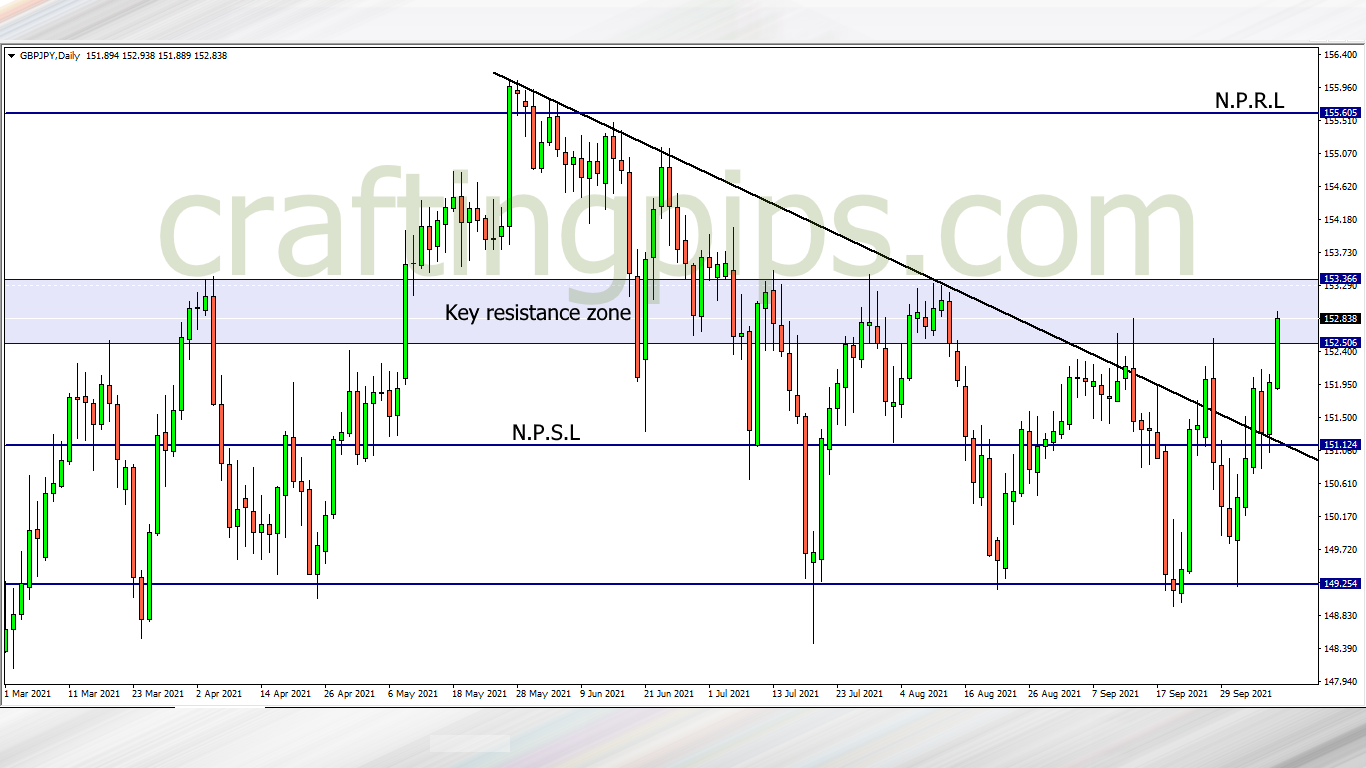
The GBP/JPY is within a key resistance zone. If for any reason the buyers get fizzled out, we may see price return back to a previous support level (151.124).
However, if we do get price break the 153.366 resistance level, then our next possible resistance level would be 155.605
3. AUD/JPY

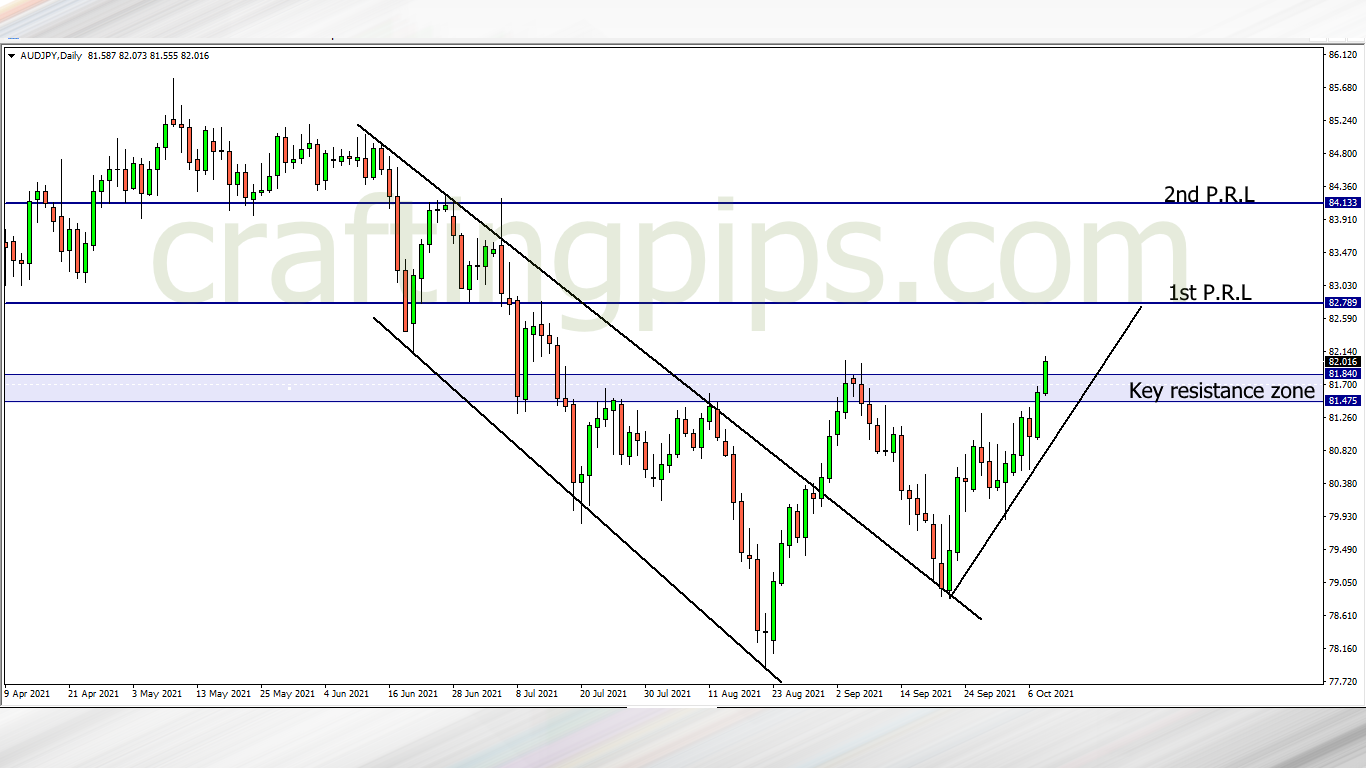
Last week, the bulls dominated the AUD/JPY and price broke a key resistance zone. This week if the bulls are still motivated, I will be waiting for a slight pullback before joining the buyers.
There are two resistance levels price may hit this week. The first possible resistance level is 82.789. If after hitting this level the buyers are still in control, then the next possible resistance level to get hit would be 84.133
What say you?
For those who are interested in joining our FREE trading group on Telegram, where trade ideas and trade-related topics are discussed, which could assist your trading career while being infected by positive vibes
hit us on Pip Crafters
Hi,
The analysis are clear, simple and easy to understand.
Thanks.
Thank you Samson,
I am glad you enjoy our analysis