Hello traders,
let’s see what the last week of July has for us.
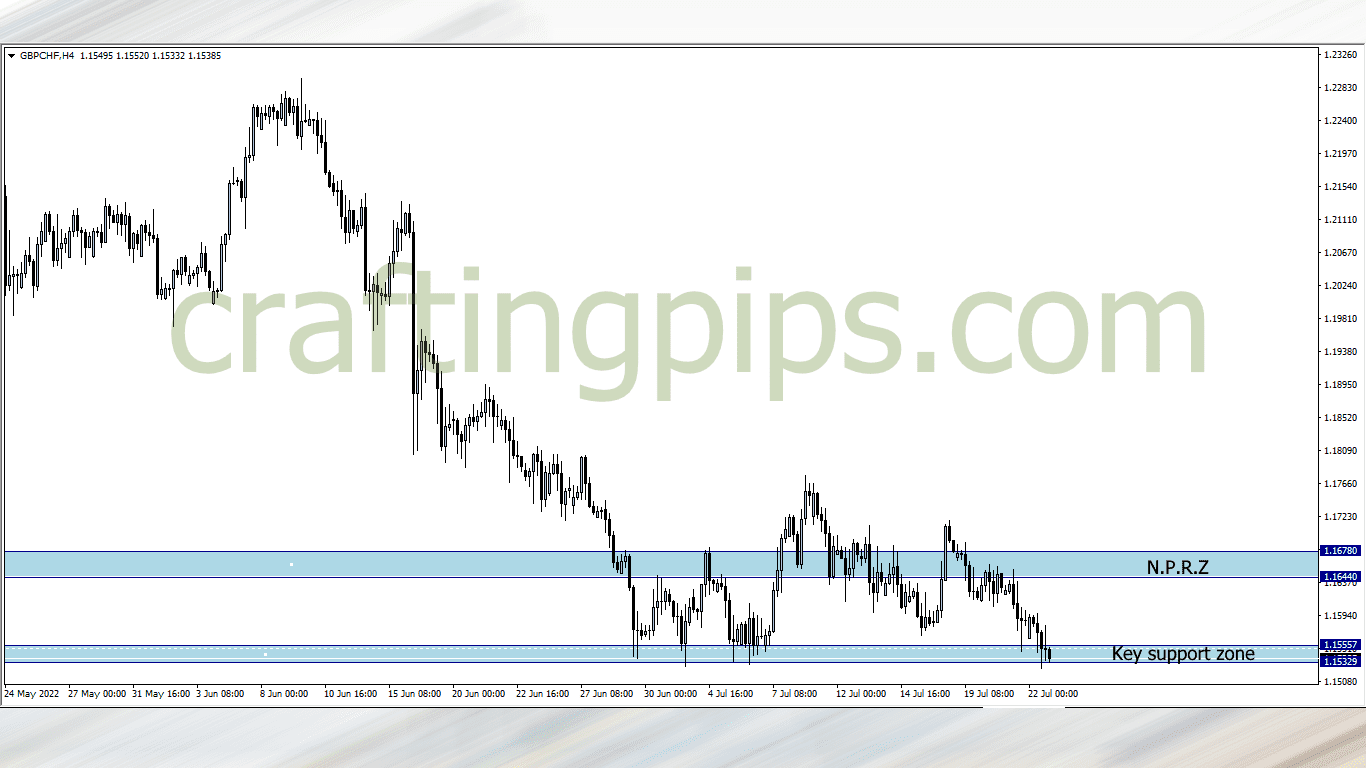
1. GBP/CHF

Price on the GBP/CHF is testing a key support zone for the 5th time in a month.
Mind you, the last and only time price broke this support zone in history was on the March of 2020, Price moved over 300 pips, hit support level 1.11634, and commenced it’s bullish journey from that support level.
This week, there is a probability that the key support zone may get broken and price falling over 300 pips to revisit the over 2 years support level (1.11634)
For us to join the bears, we will need a bearish confirmation which may come in the form of a daily candlestick close or whatever you are used to
We should also know that the market may resume on Sunday and price get’s rejected at the current support level. This may give buyers a temporary advantage. Meaning price revisiting a previous resistance level.
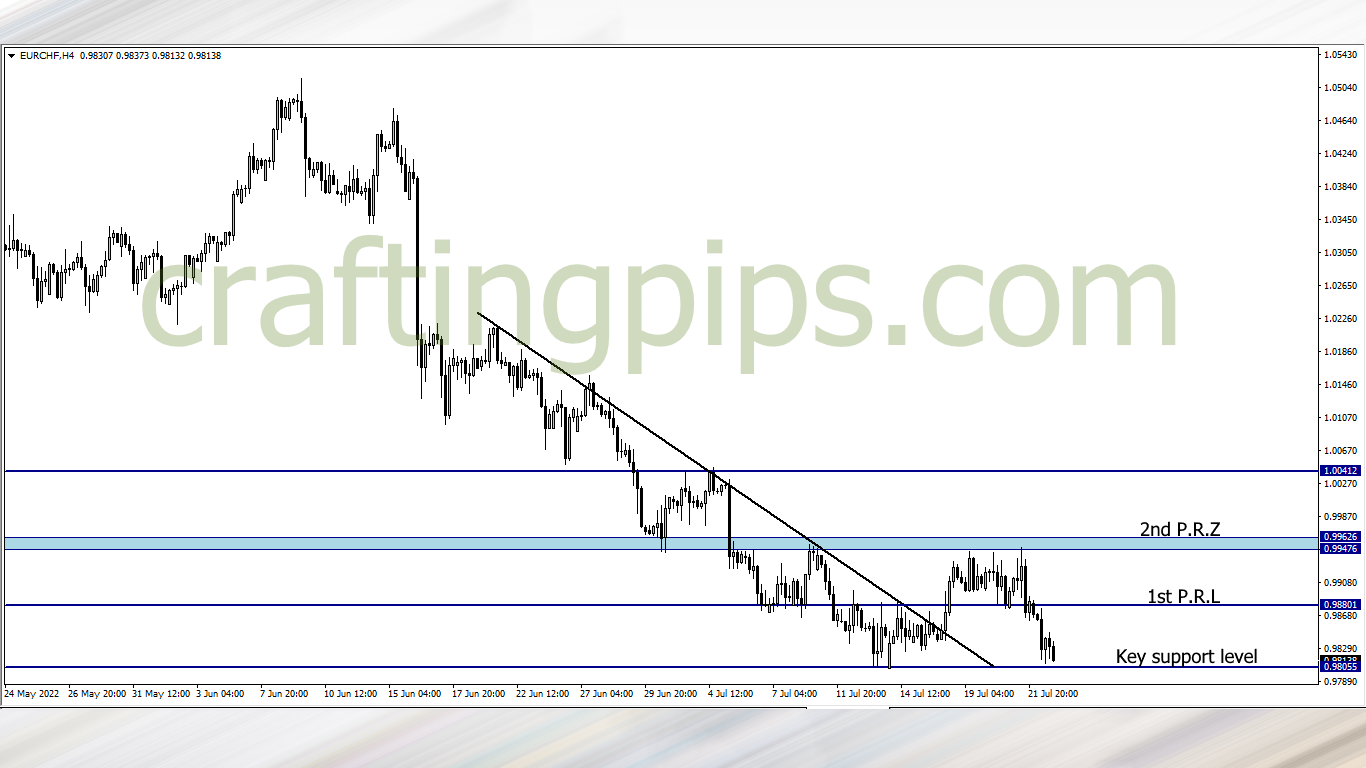
2. EUR/CHF

EUR/CHF unlike GBP/CHF is currently resting on the lowest support level in the history of this pair.
This means that: A bearish breakout at this point could spew anything from 200 and above pips this week.
We should also be wary of the looming buyers at the current support level (0.98055). A rejection may take price back to resistance level 0.98801
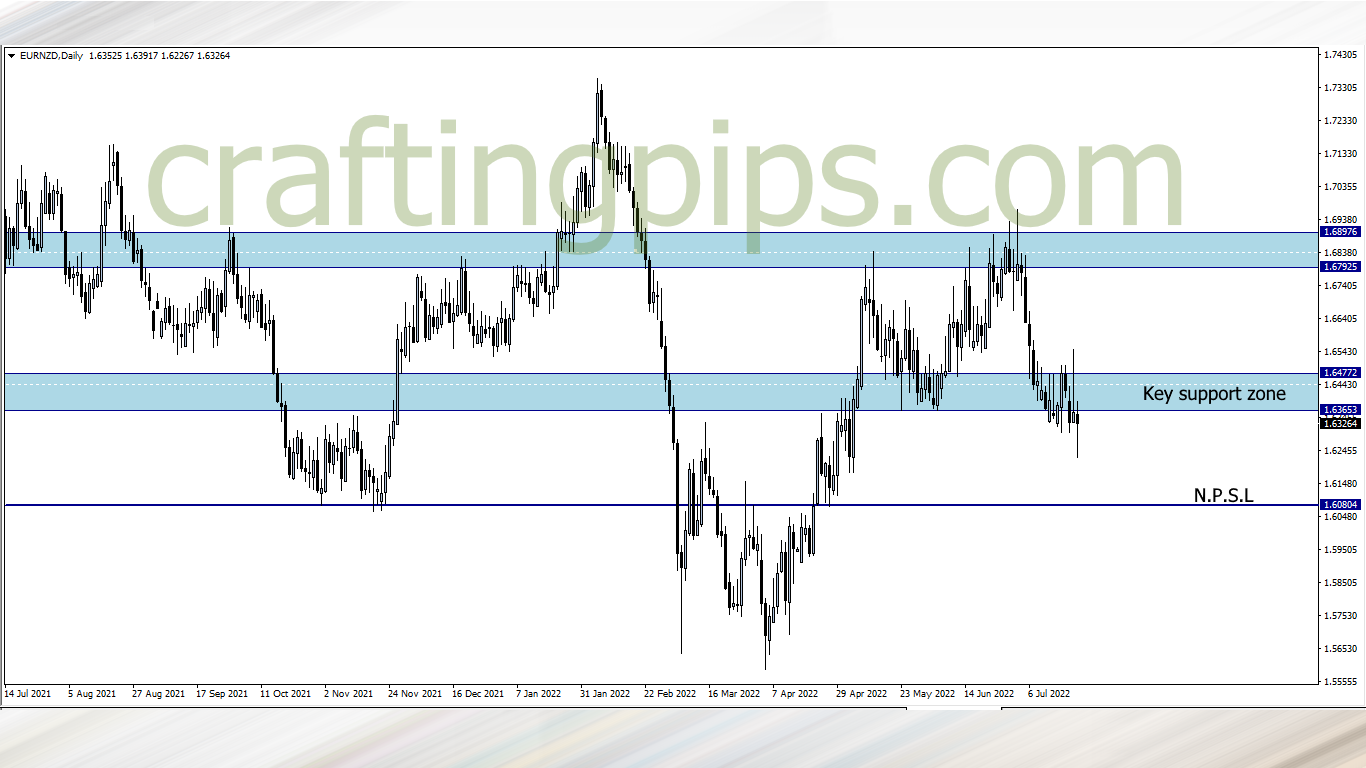
3. EUR/NZD

The key support zone has become a good key resistance zone.
Last week price gave us a good rejection on the daily time when trying to break the previous key support zone (now a key resistance zone)
The bears should have an upper hand this week, and hunting for sell opportunities won’t be out of place. Our possible support level will be 1.60804
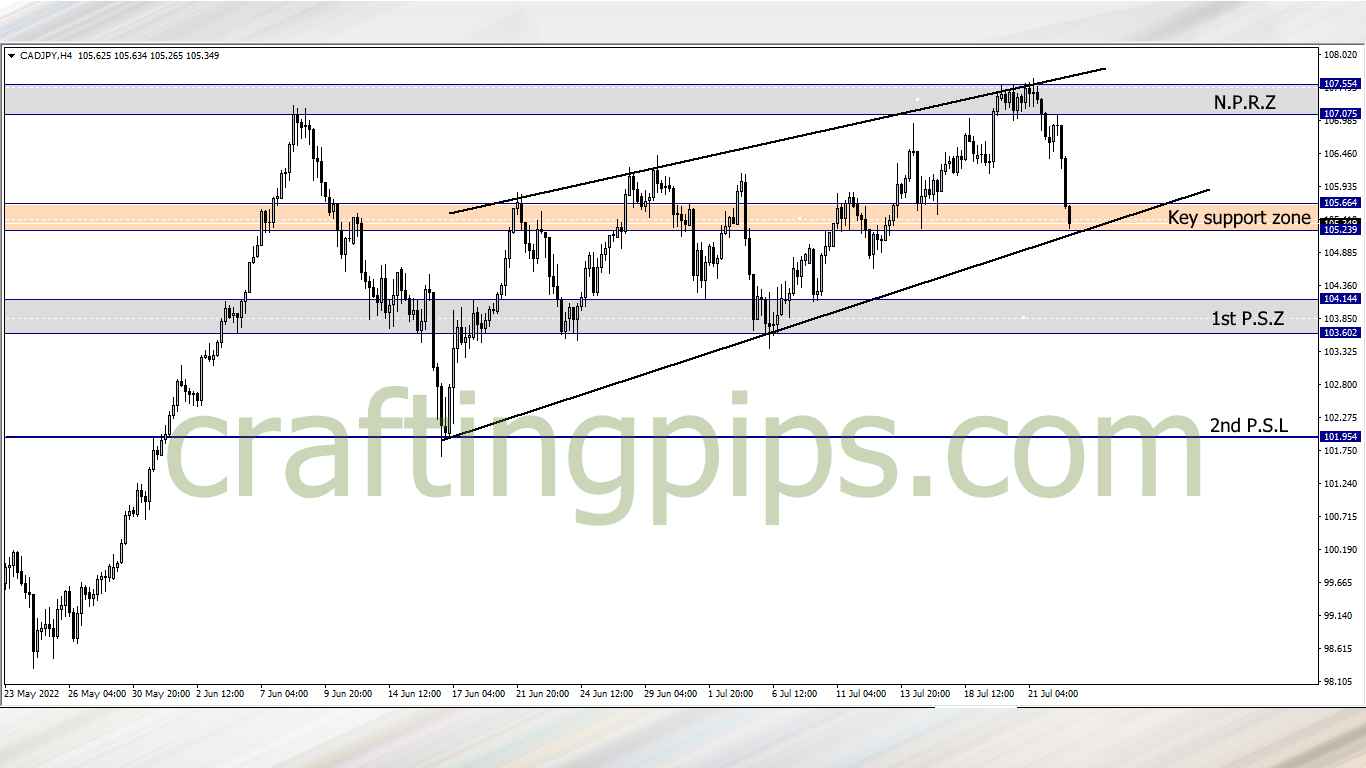
4. CAD/JPY

A beautiful ascending channel can be seen on the CAD/JPY.
If the bulls have any fight in them, the current support zone is a great place to wage a war with the bears.
If the week resumes with a weak Canadian dollar, and the current support zone gets broken, then our next possible support zone would be the purple zone marked on the chart.
However, if price bounces off the current support zone, then resistance level 107.075 may be revisited once more by price.
What say you?
Traders who are interested in joining our FREE trading group on Telegram, where trade ideas and trade-related topics are discussed, which could assist your trading career while being infected by positive vibes
hit us on Pip Crafters