Hello traders,
let’s see what the charts have for us this week:
1. EUR/USD

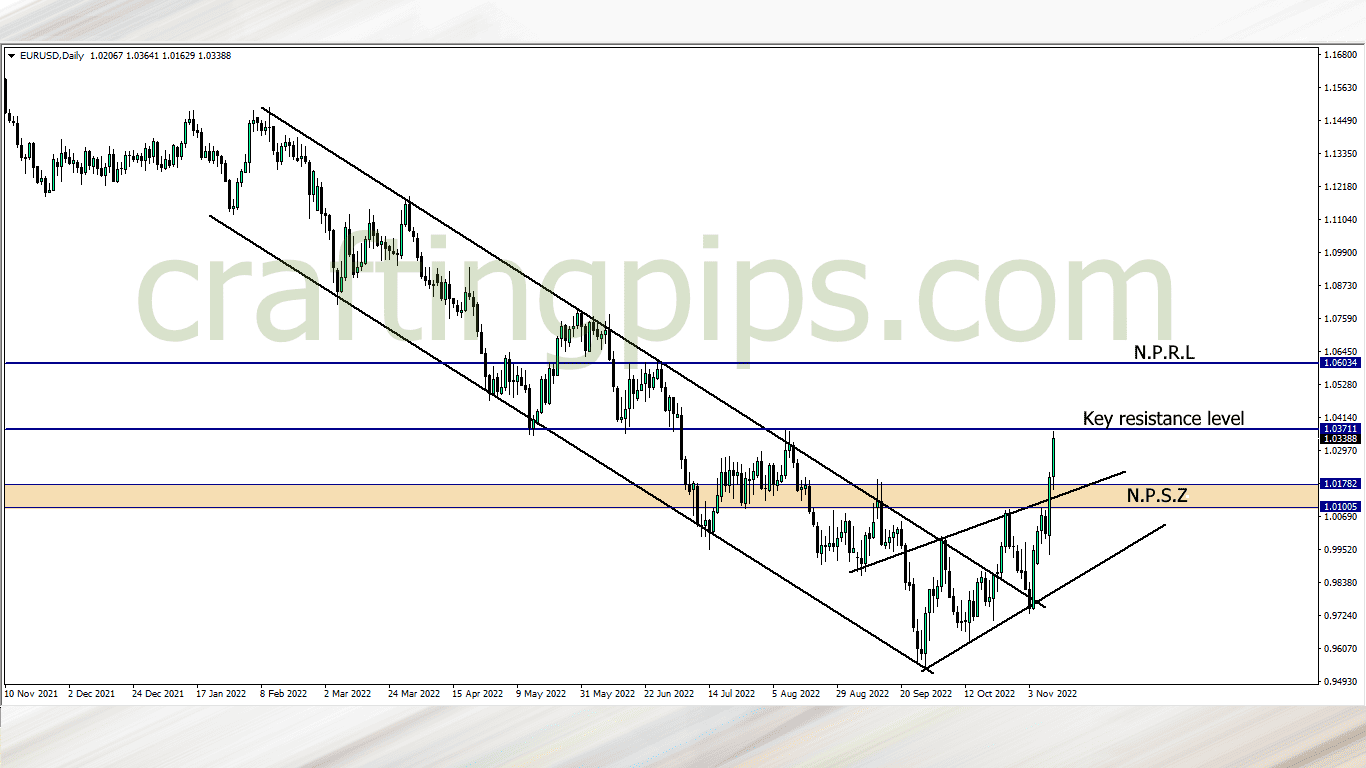
EUR/USD closed last week after touching a key resistance level (1.03693)
This week there is a strong possibility that we may see a pullback, meaning price may revisit the previous support zone (painted brown) if the bulls fail to break the 1.03693 resistance level.
However if the bulls continue their bullish campaign this week and break the current resistance level, then our next possible resistance level would be 1.06223
2. GBP/USD

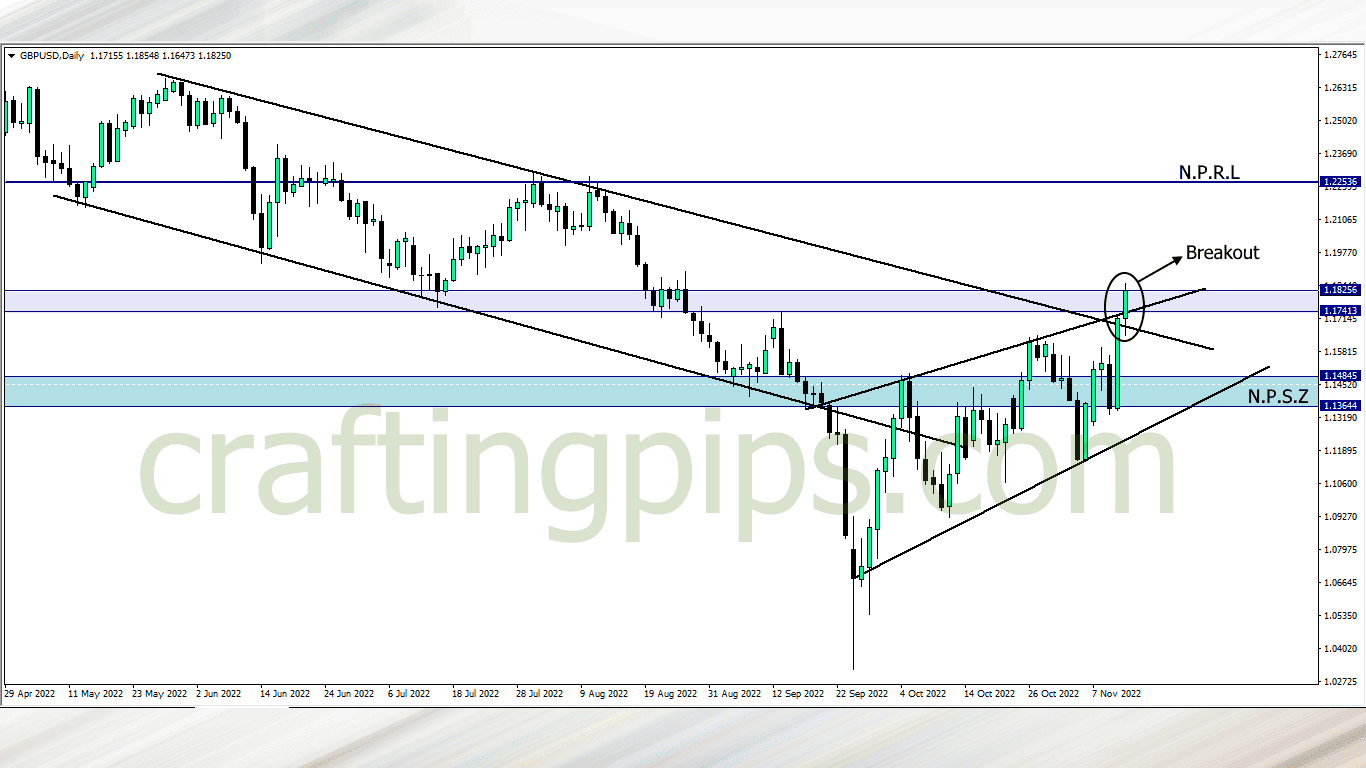
Last week GBP/USD closed bullish. On the daily timeframe we can see a breakout of a key resistance zone, and several other resistance levels
This week there is a possibility of a slight pullback before price continues its bullish journey to the next possible resistance level 1.22354
3. USD/JPY

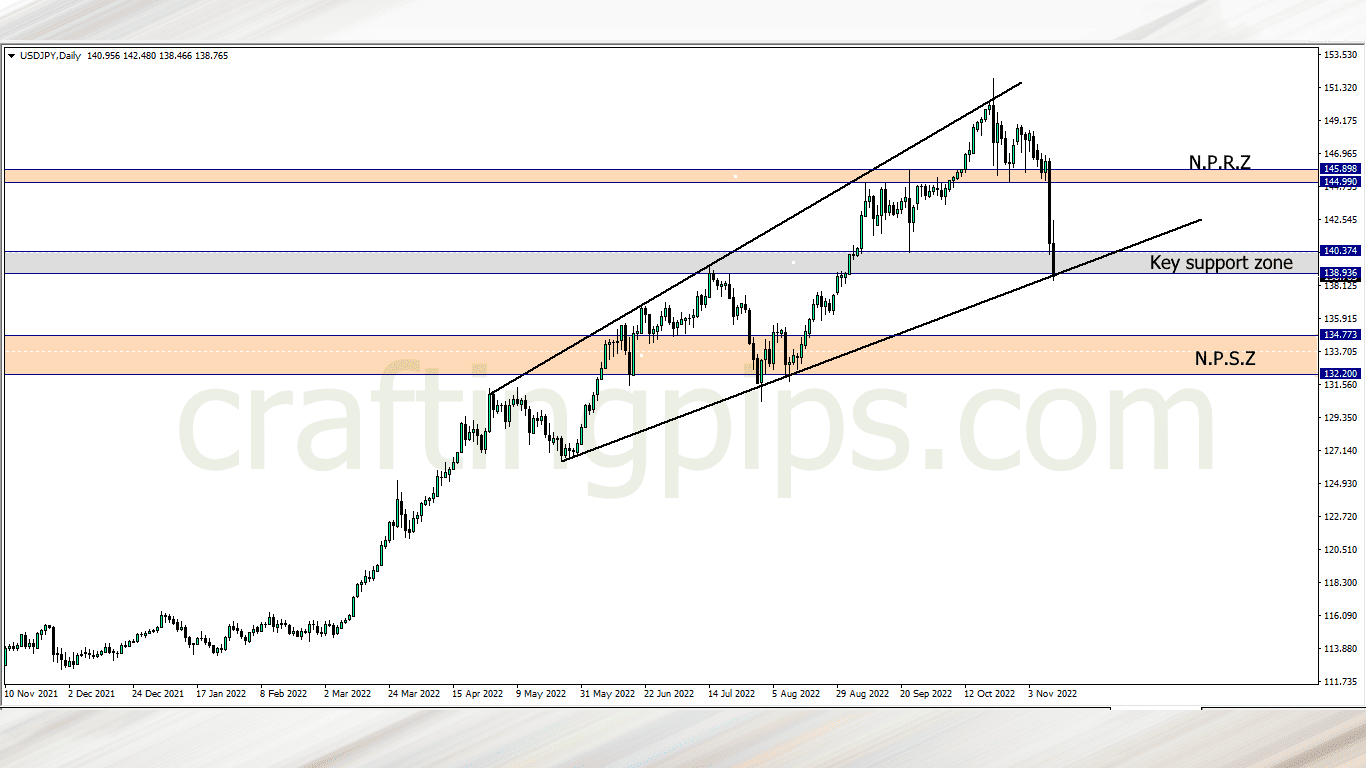
Last week Thursday we saw a huge fall of the USD, after the CPI news release.
USD/JPY started its fall after spending 2 weeks forming a consolidation around the the 144.990 support level. An ascending expanding channel can be spotted, and price is resting on a critical support zone.
If we do get a breakout below the current support zone, price next support zone will be the red channel marked in the chart. As the trading week resumes, there is a possibility that price may also bounce off the current support zone, and head back to the previous resistance zone, so patience is needed and a bullish or bearish confirmation is a must before taking this trade
Personally I have a bearish bias, so I will be waiting for a breakout below the current support zone
What say you?
Traders who are interested in joining our FREE trading group on Telegram, where trade ideas and trade-related topics are discussed, which could assist your trading career while being infected by positive vibes
hit us on Pip Crafters