Hello traders,
Another week loaded with great setup. Let’s hit them charts:
1. EUR/USD
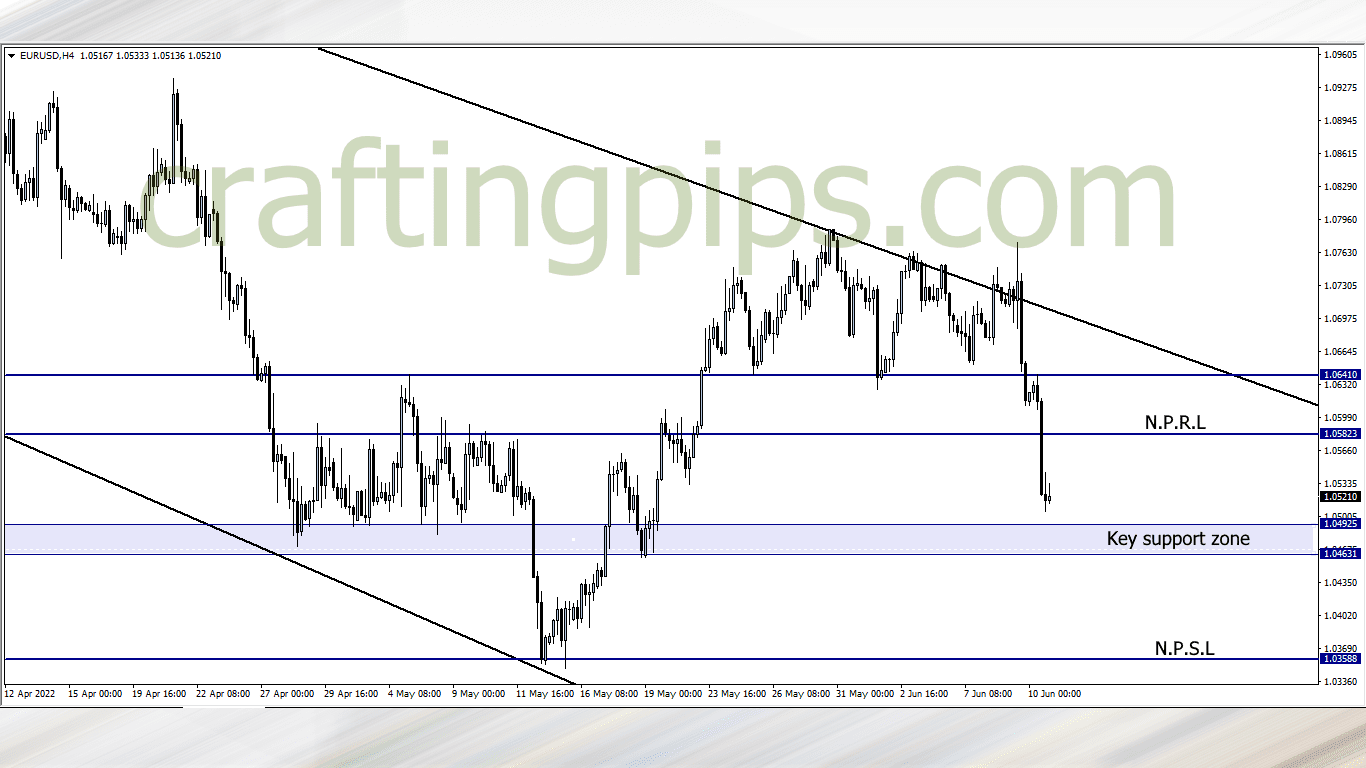
Price on the EUR/USD is approaching a key support zone after breaking out from support level 1.05823.
We may see price stall for a bit before a reversal occurs, which may take price back to resistance level 1.05823 or a breakout of the key support zone, which may further encourage the bears to hit the next possible support level (1.03588)
2. USD/CAD
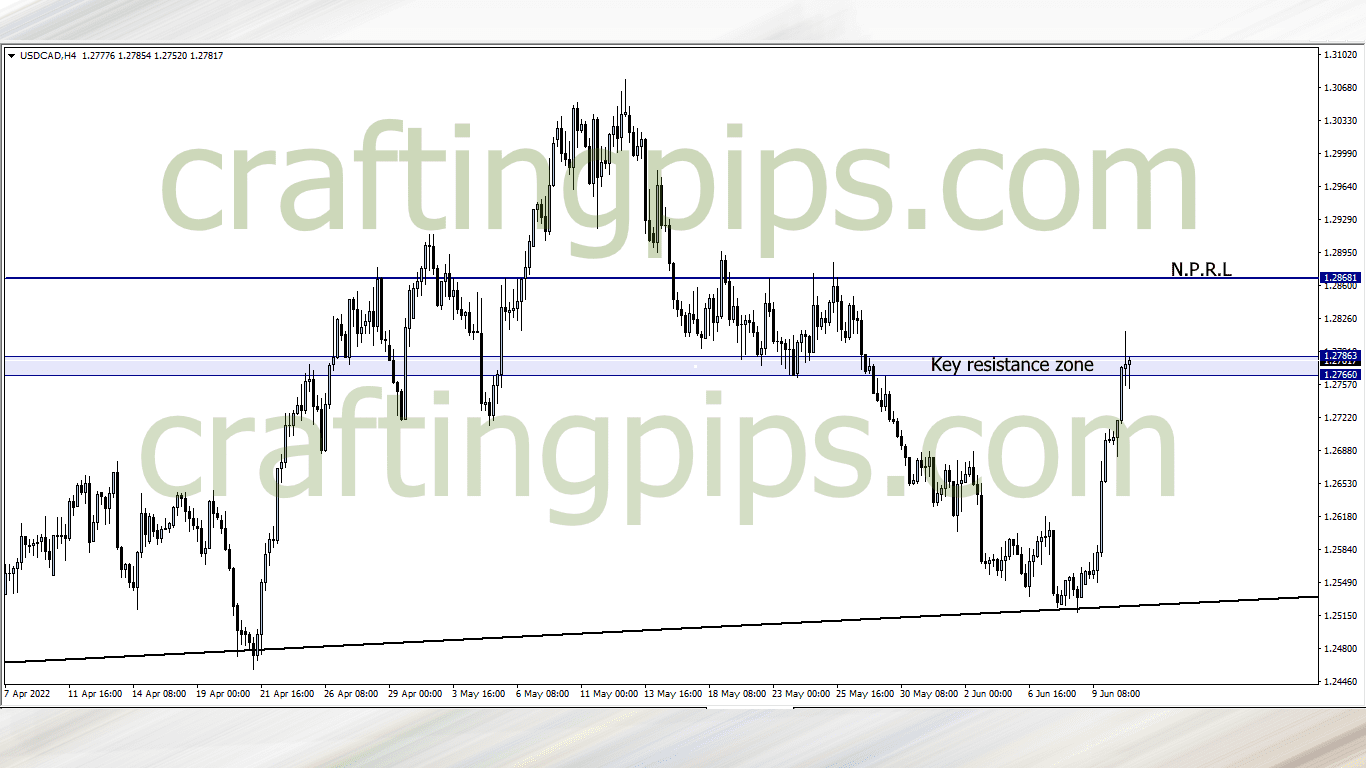
USD/CAD has reached a key resistance zone. A breakout through this level and a buy confirmation may take price to the next possible resistance level (1.28681) within the first few days of the week.
However, if the week resumes with us getting a reversal confirmation, then price will most likely revisit support level 1.26819
3. USD/JPY
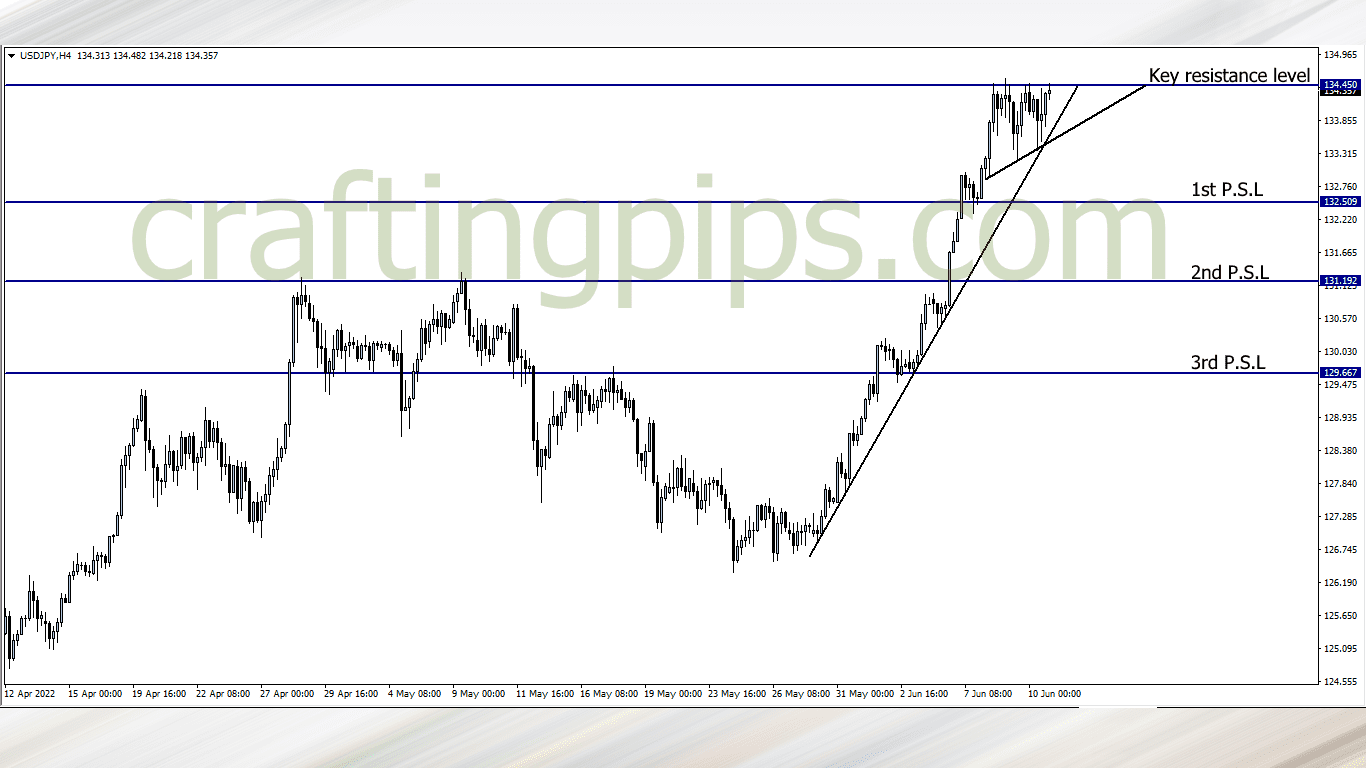
USD/JPY struggled to break the 134.450 all through last week.
The current resistance level was last hit on the 1st of January, 2002 (Exactly 20 years plus ago).
If a reversal happens at this point, we may most likely see this pair return to support level 132.509 first, and if the bears persist, support level 131.192 and 129.667 may also get hit
There is also a possibility that the 20 years old resistance level could get broken. If that happens we will join the bulls and trade with caution.
When I mean caution, I mean you trading with a trailing stop loss.
4. GBP/JPY
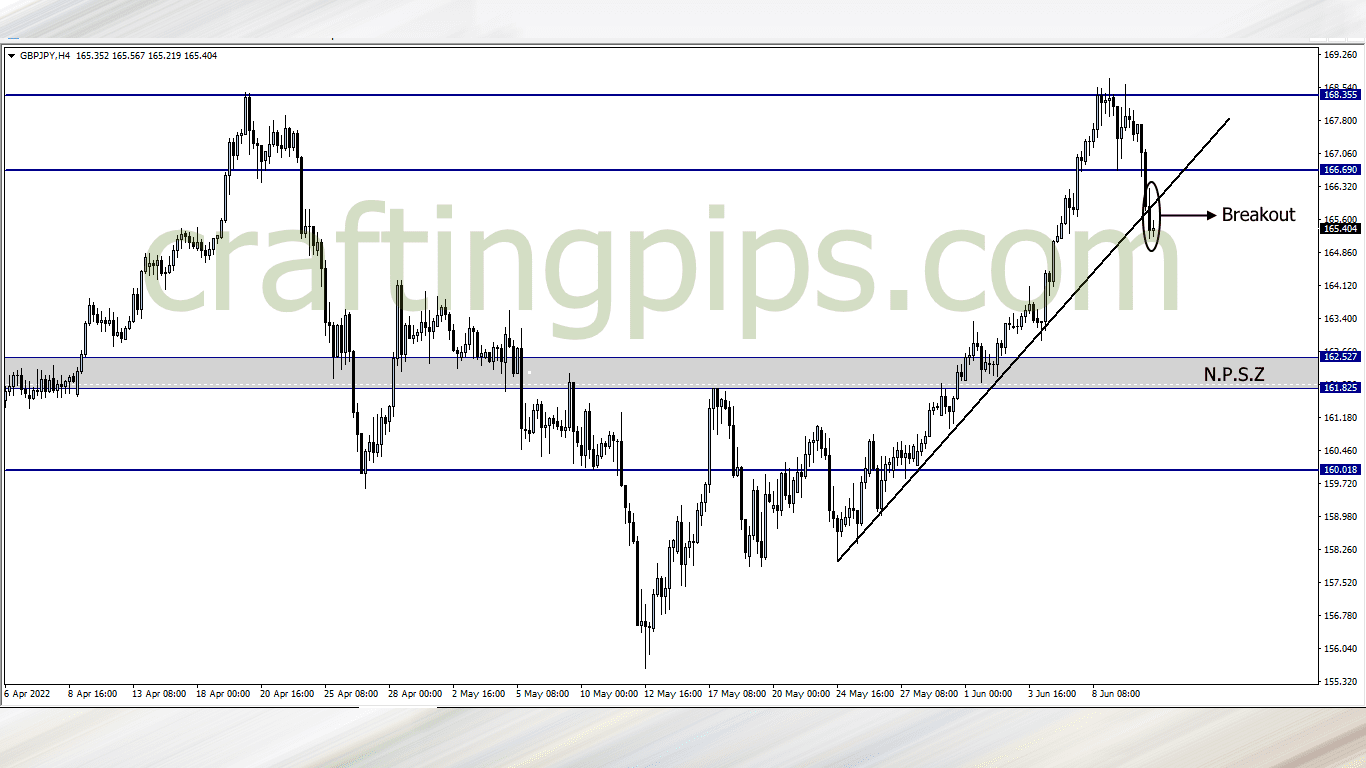
Last week, the GBP/JPY did not only begin a reversal after hitting resistance level 168.355, but also a bearish breakout through the ascending trendline.
If the bears gives us a bearish confirmation this week, then we could join them to the next possible support level (162.527)
5. AUD/USD
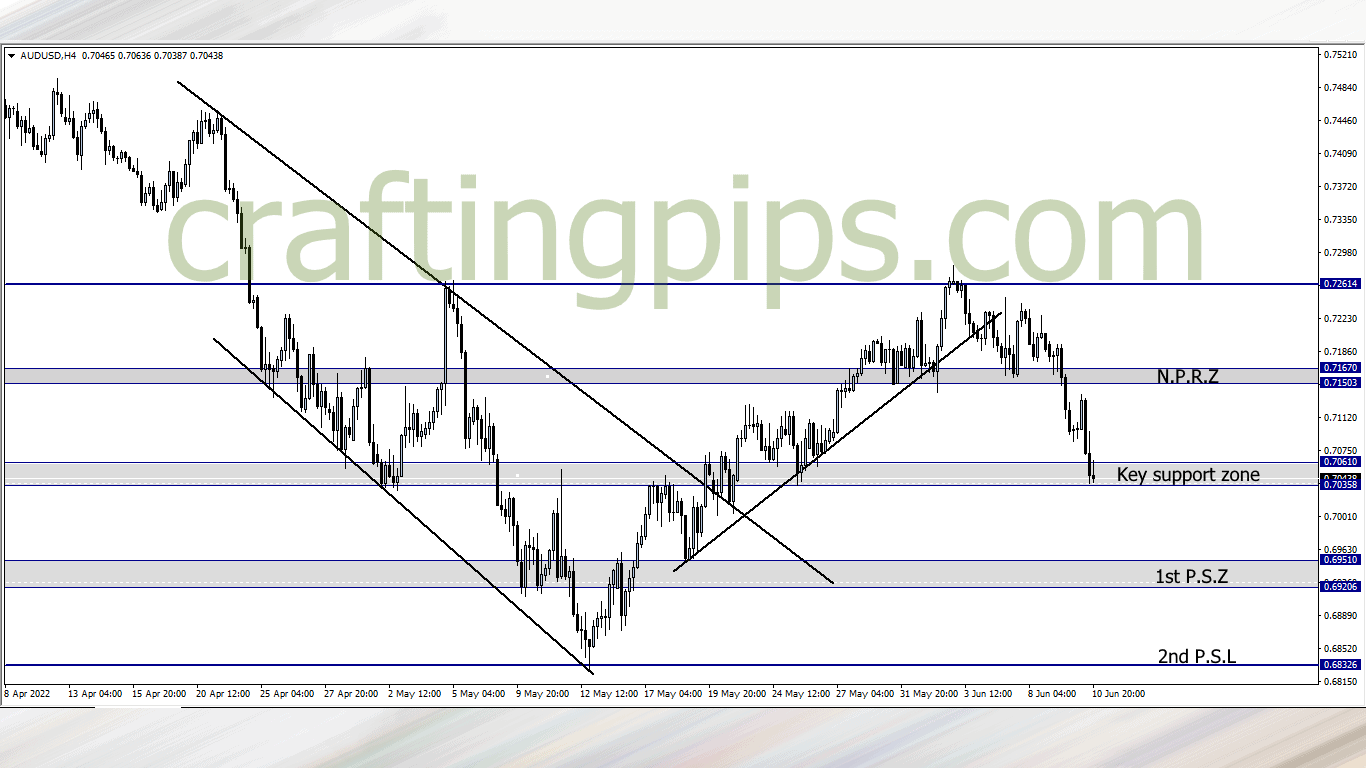
Last week we saw the AUD/USD fall through a previous support zone (0.71670-0.71503), to the current support zone (0.70610-0.70358)
There is a possibility that price could use the present support zone as a spring board to bounce back to the previous support zone which will now act as a resistance zone (0.71670-0.71503), or price could break through the current zone and hit the next possible support zone (0.69510 – 0.69206)
All we need as traders is a confirmation in order to determine our next line of action.
6. NZD/USD
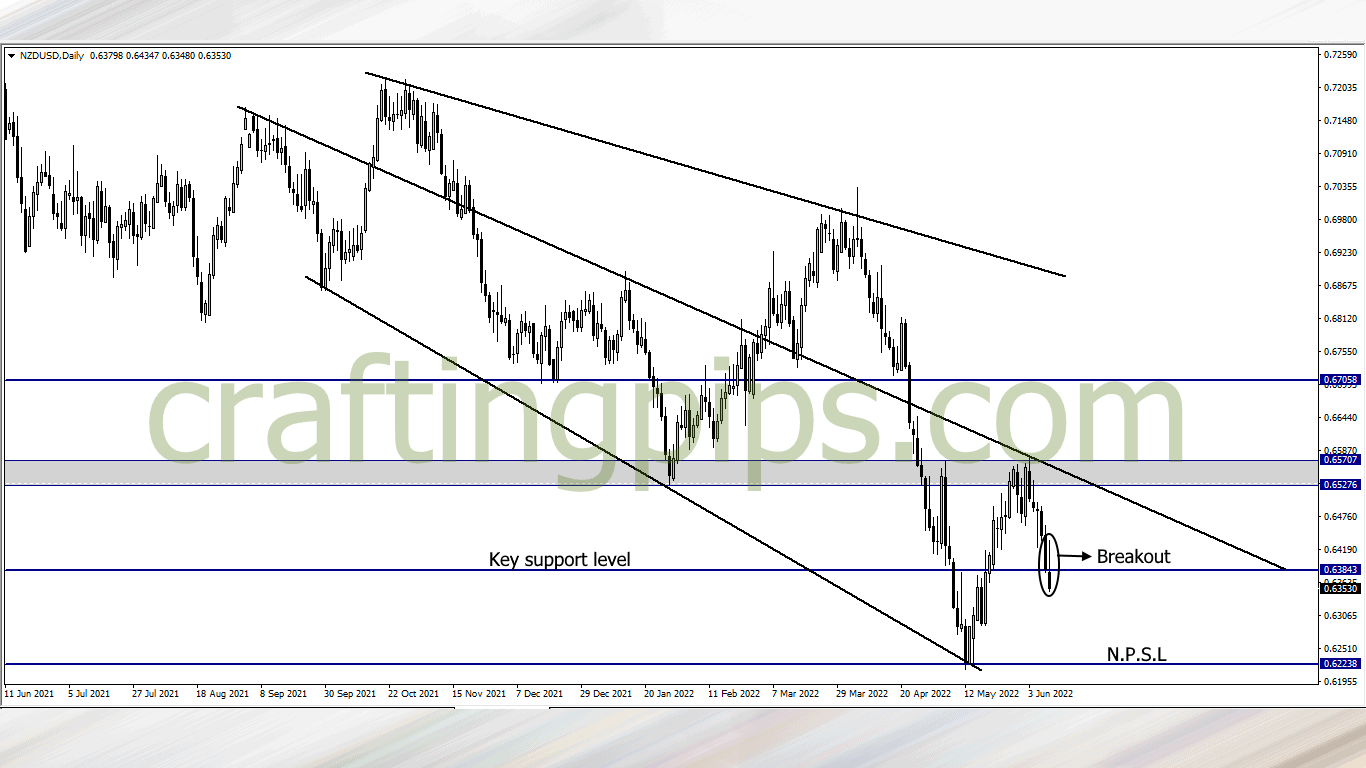
On the daily time frame of the NZD/USD, we can see price breaking through a key support level (0.63843).
Price also gave us a strong bearish candlestick signifying a trend continuation. If the opening of the market does not invalidate this setup, we may see price hit support level 0.62238
7. XAU/USD (GOLD)
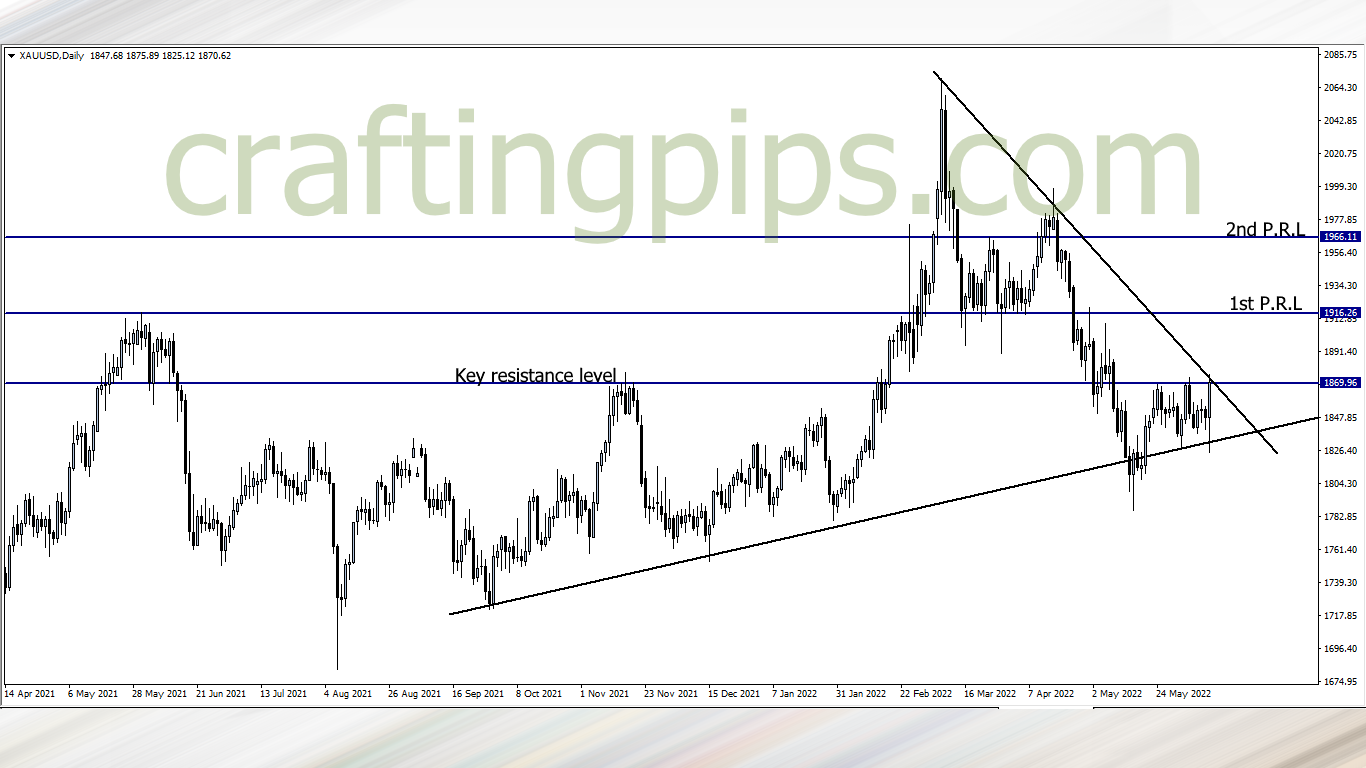
On the daily time frame, Gold closed with a strong bullish pinbar last week Friday. Price has also formed consistent higher lows on the ascending trendline, which signifies a possible breakout of resistance level 1869.96
This trade may materialize after the close of the daily candlestick on Monday. All we need to see is a breakout on the daily candlestick, then a bullish entry confirmation. If that happens, then we may join the bulls to the next possible resistance level (1916.26)
What say you?
Traders who are interested in joining our FREE trading group on Telegram, where trade ideas and trade-related topics are discussed, which could assist your trading career while being infected by positive vibes
hit us on Pip Crafters