Hello Traders,
Are you gearing up for the last trading week of the month?
Then you are in the right place, let’s hit the charts…
1. EUR/USD
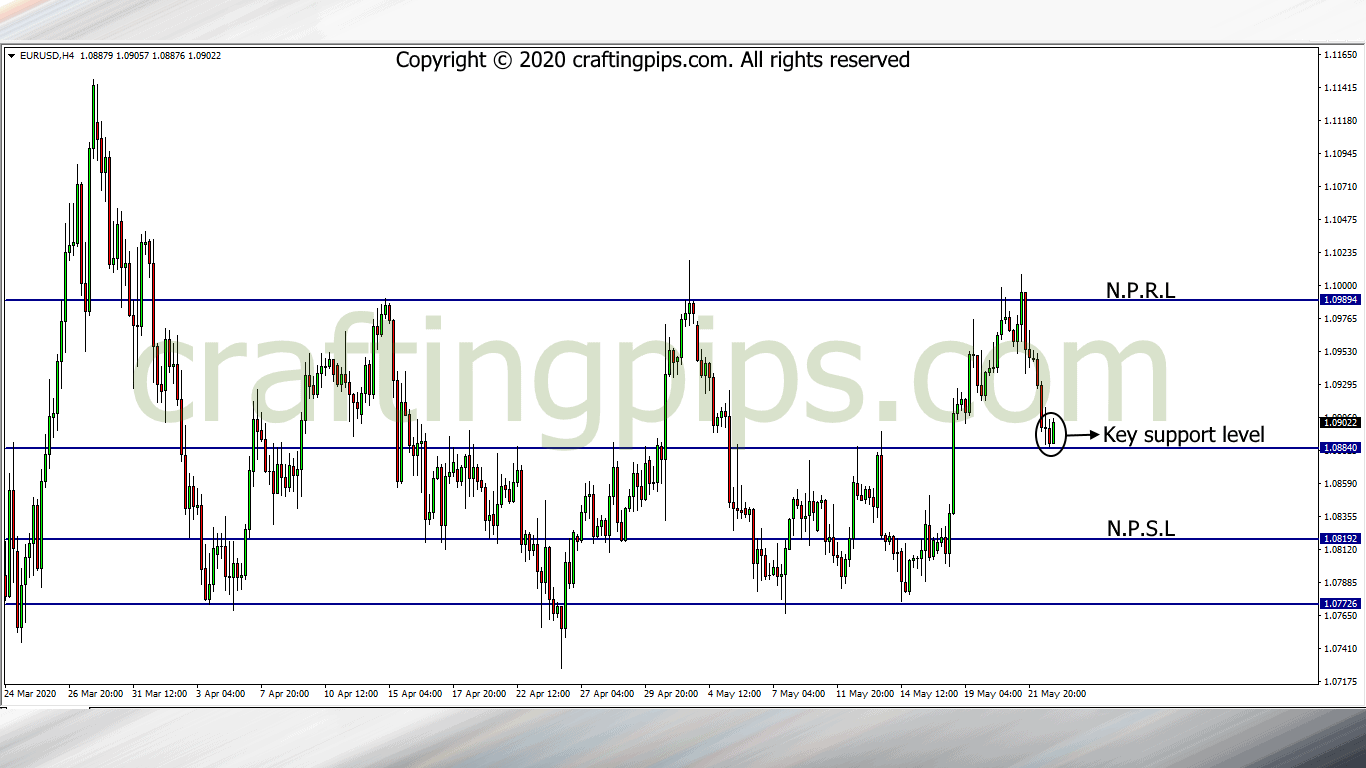
EUR/USD on the daily chart is bearish.
On the 4-hour time frame, there is a minor support level (1.08840) that needs to be broken of the Bears are still strong enough to pull price to the next possible support level (1.08192).
Though my bias is bearish on this trade, we should also keep in mind that it’s Sunday/Monday, and there is a possibility that the market could decide to reverse and revisit resistance level 1.09894.
2. NZD/JPY
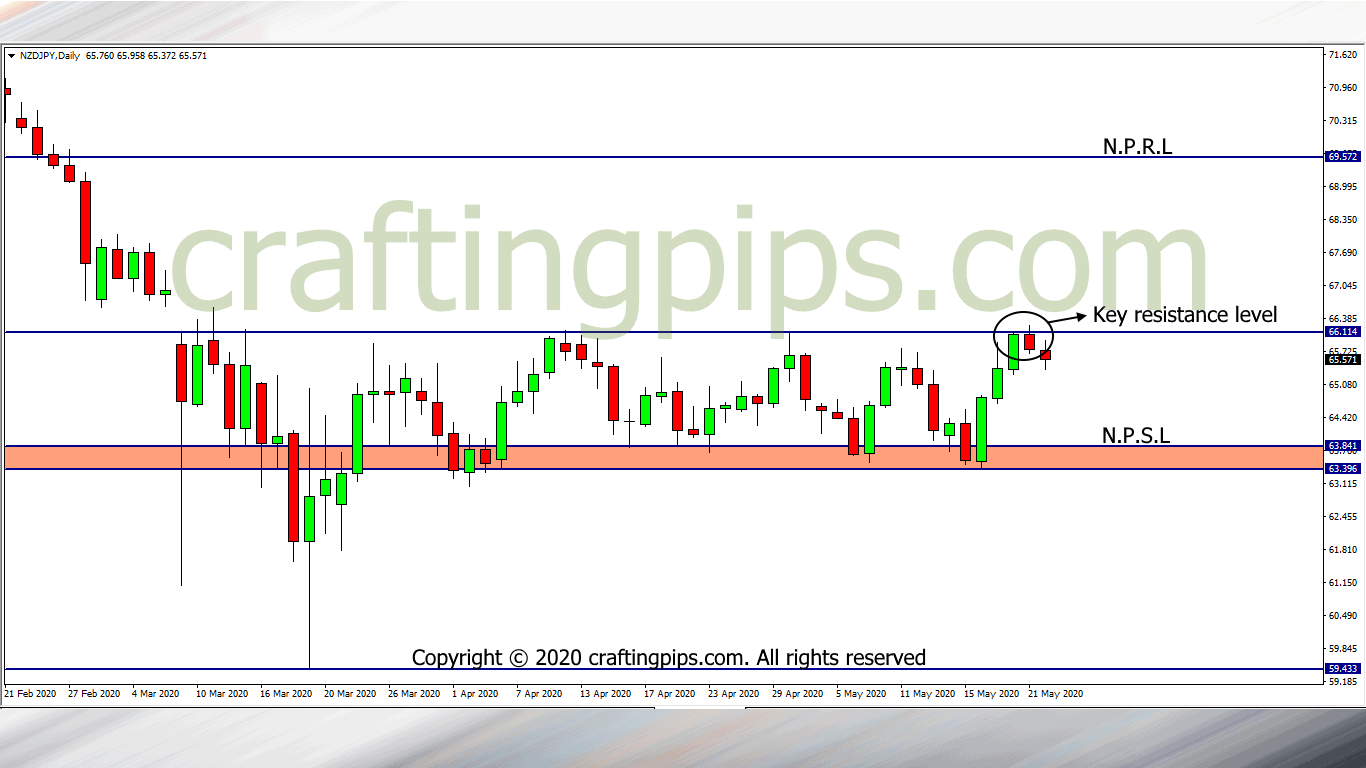
On the weekly chart of the NZD/JPY, price has formed an expanding descending channel, and for over 2 months price has formed a consolidation at the foot of the channel.
On the daily chart we can see that price closed on Friday showing signs of reversal.
If the reversal is confirmed, our next support level would be 63.841, and if we get to see resistance level 66.114 compromised by the Bulls, then the buyers may take us to our next possible resistance level (69.572)
3. XAU/USD (GOLD)
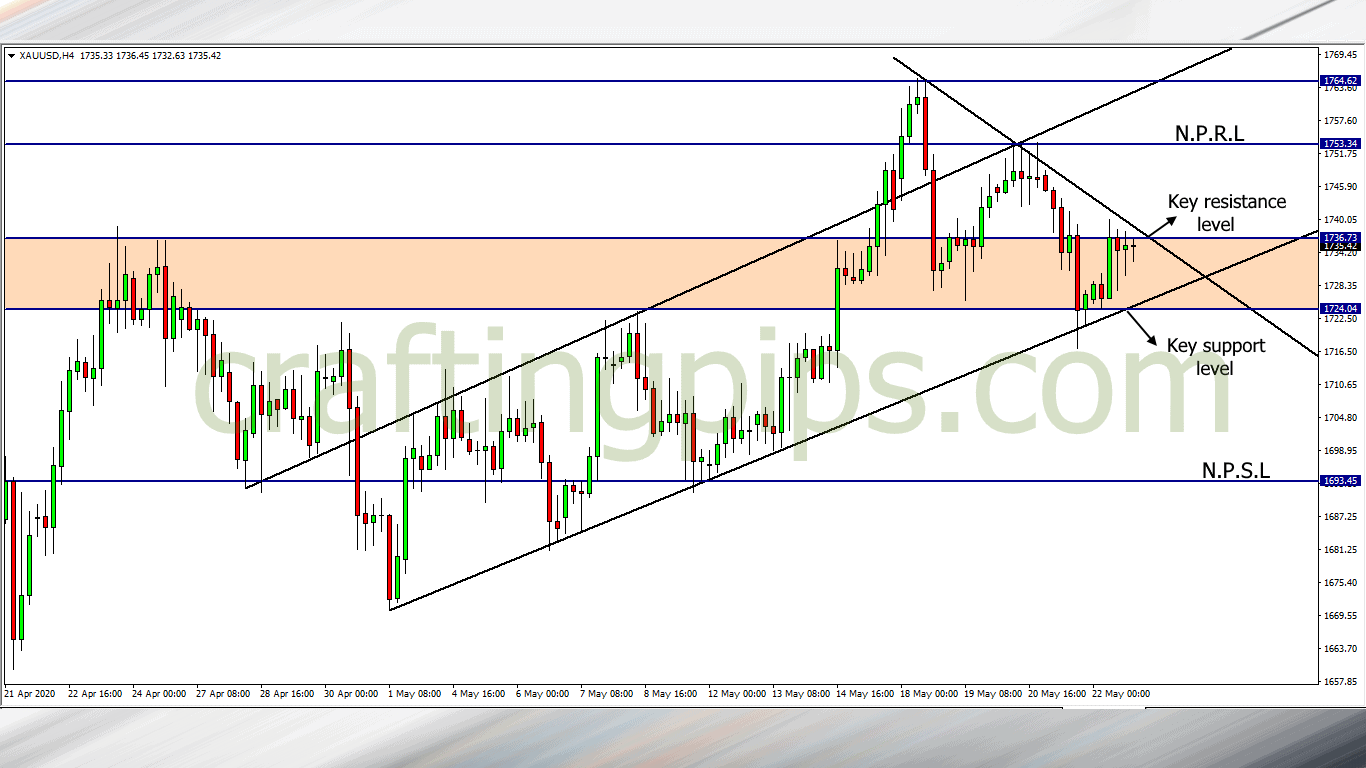
Gold on the daily chart is respecting resistance level 1753.34.
On the 4 hours time frame, we are seeing Gold on the 4th support leg (Ought to be the weakest leg).
In my opinion, there is a huge possibility that price could break support level 1724.04 and go further down to hit the next support level (1693.45).
On the other hand, let’s not forget that it’s the beginning of the week, and price is plagued by unpredictability.