Hello traders,
let’s hit them charts:
1. EUR/USD

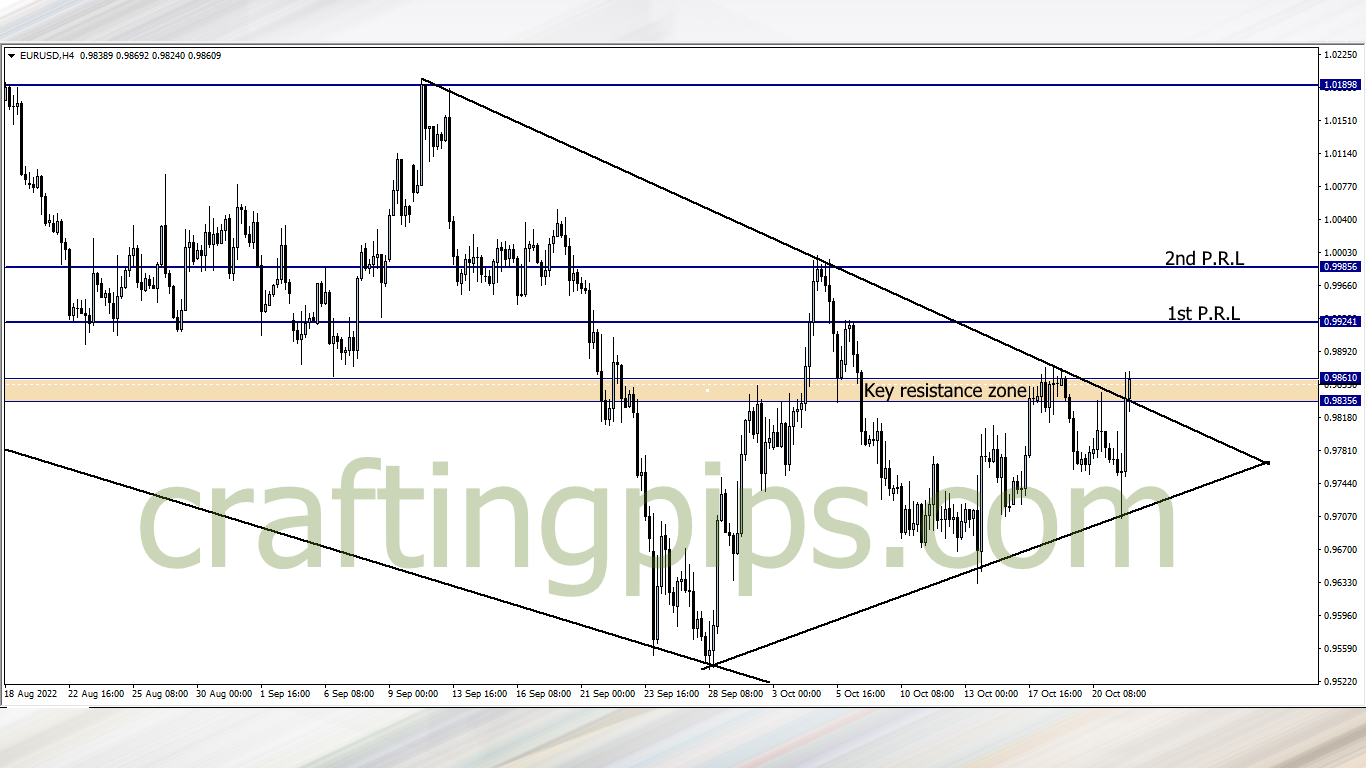
At the close of the market last week Friday, price on the. EUR/USD closed within the key resistance level after bouncing off an ascending trendline which gave us a higher low.
This week, looking for a bullish breakout is key. If that happens, then we have two resistance levels to watch out for:
- 1st possible resistance level (0.99241) and
- 2nd possible resistance level (0.99856)
2. CAD/JPY

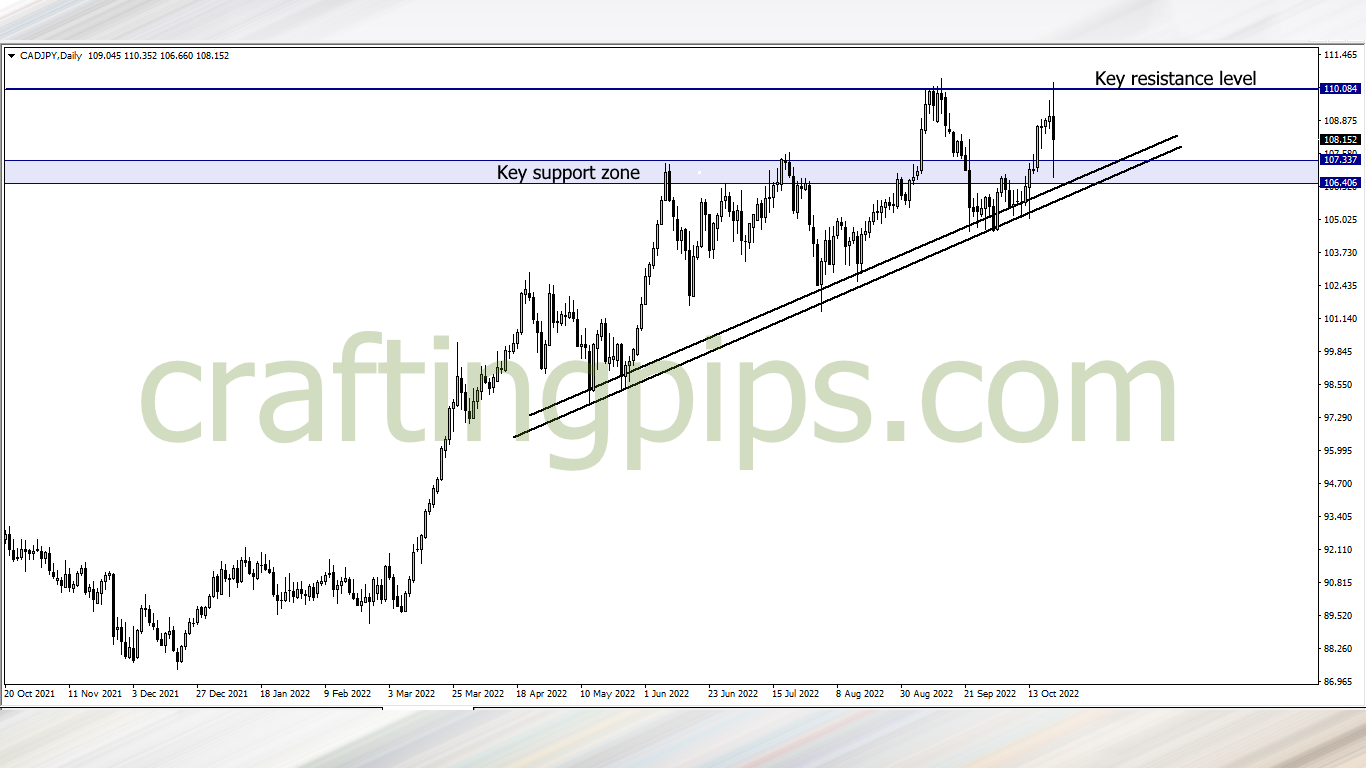
Last week on the CAD/JPY, resistance level 110.084 proved difficult for the bulls to break, so we had a double top play out perfectly.
This week I will be checking how well the key support zone holds price. If we do get a bounce, then resistance level 110.084 will most likely be buyers next target.
This week I won’t be too interested in price breaking below the ascending trendline because of the inconsistencies of the next possible support level
3. CHF/JPY

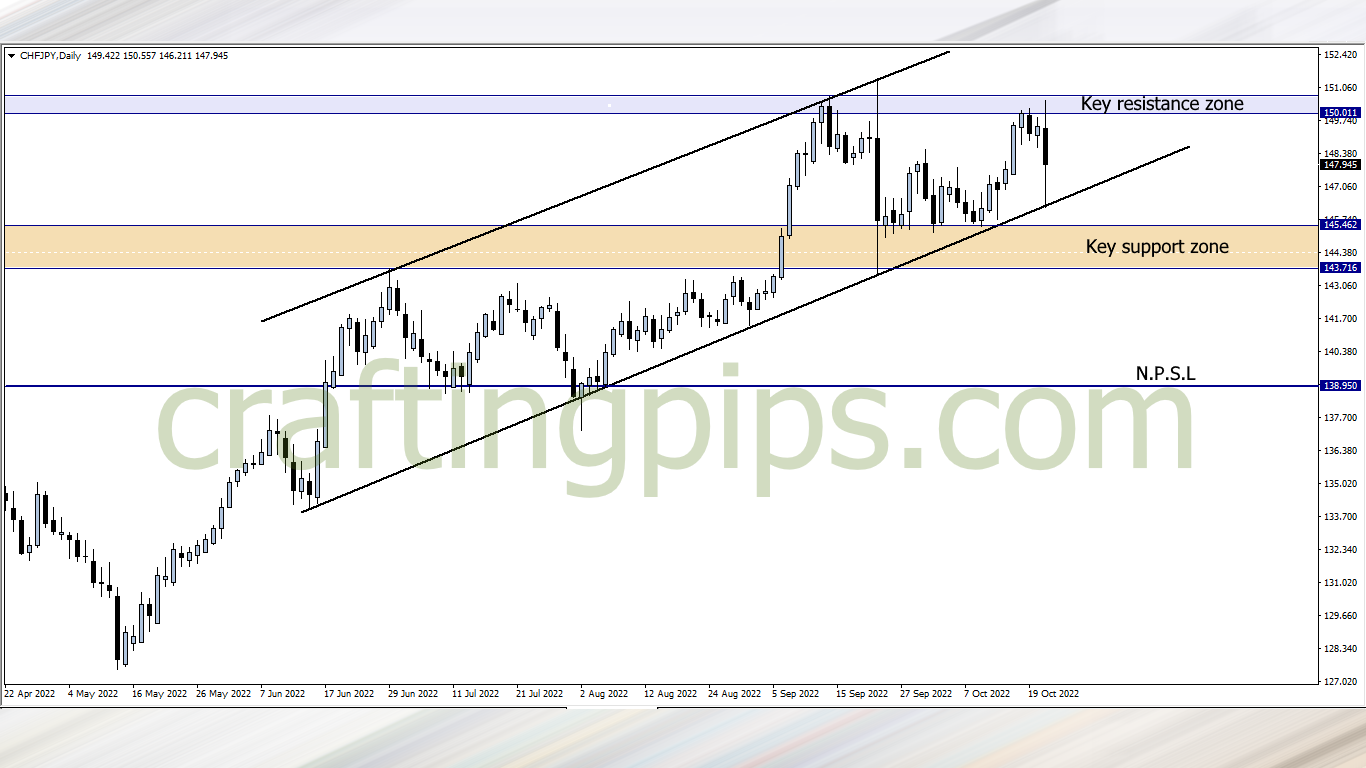
CHF/JPY and CAD/JPY have a lot of similarities in structure, the only difference on the CHF/JPY is that if the key support zone get’s broken, selling to the next support level (138.950) won’t be out of place.
Price retesting the key resistance zone, and a possible breakout is something to watch out for this week
4. XAU/USD

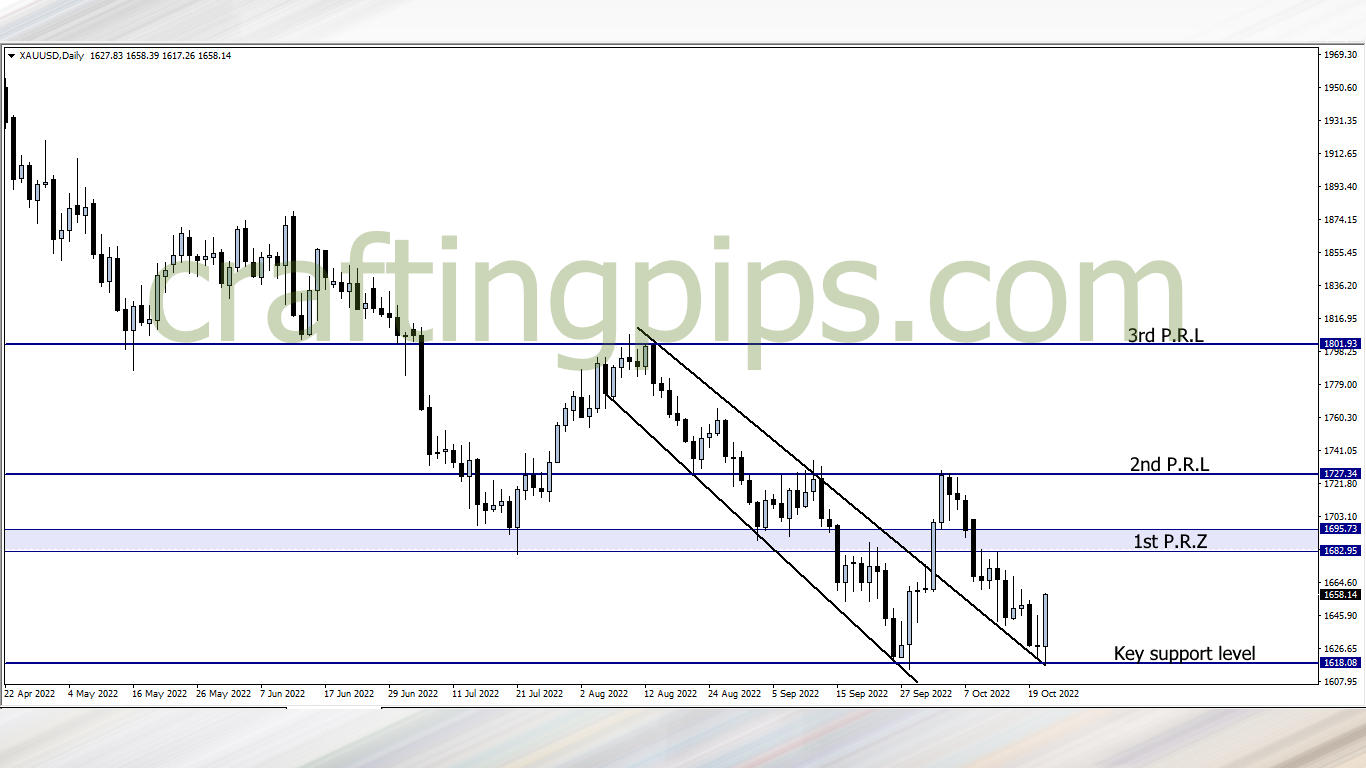
Double bottom can be spotted on Gold.
The two resistance zones I expect price to most likely hit are shown in the chart above. This week all we need to do is look for bullish trading opportunities on the lower time frames.
What say you?
Traders who are interested in joining our FREE trading group on Telegram, where trade ideas and trade-related topics are discussed, which could assist your trading career while being infected by positive vibes
hit us on Pip Crafters
NOTE:
Hello traders, Are u tired of wasting your money on failed prop firm challenges?
Say no more…
Fundyourfx is willing to give u a DIRECT FUNDED account at an affordable price If u are interested, contact me & get my coupon code for a -5% discount.