Hello traders,
let’s hit them charts:
1. EUR/CHF
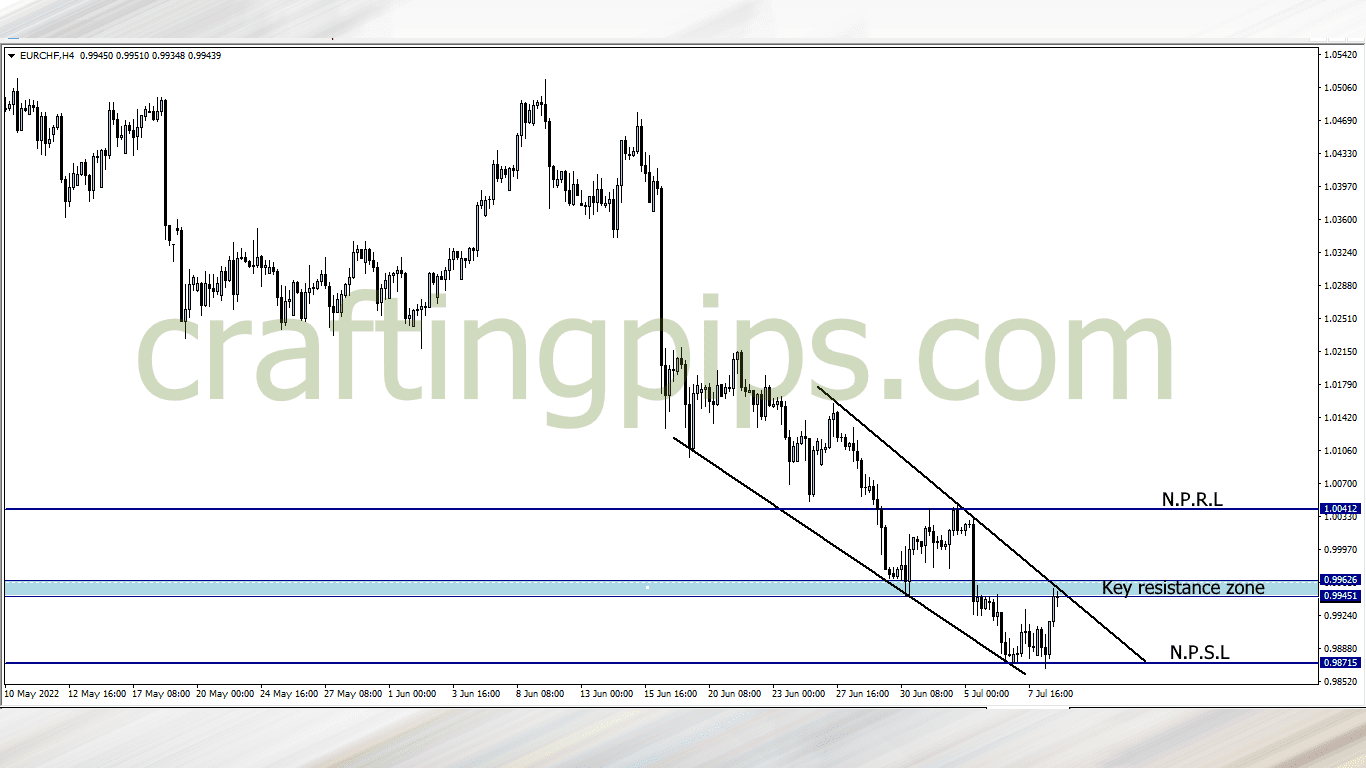
Last week support level 0.98715 was tested twice by the bears and each attempt by the bears ended with a rejection that formed a higher high.
To give us context, go to your monthly time frame and you will find out that the present support zone was tested twice in the past (2011 and 2015) before price started a bullish run.
This week there is a huge tendency that price may break the key resistance zone and start it’s journey to the next possible resistance level (1.00412)
2. NZD/USD
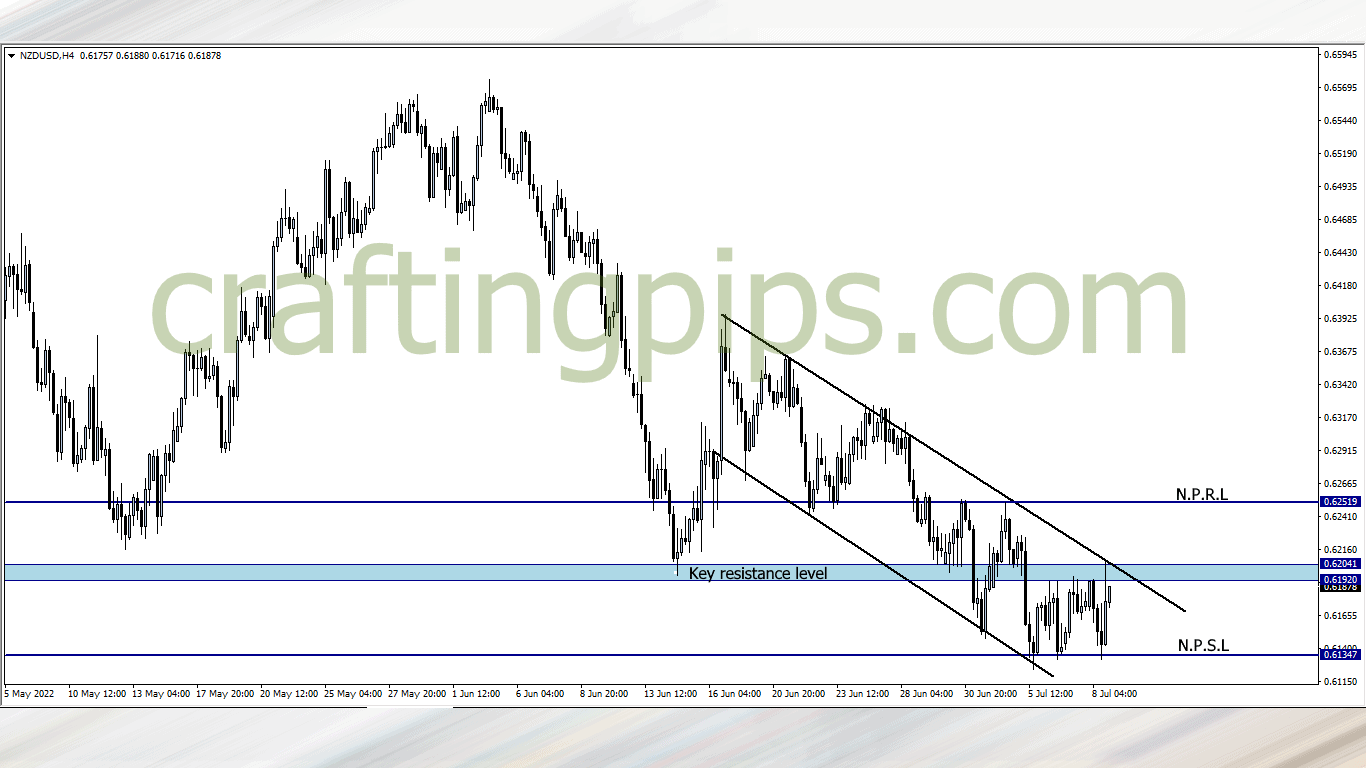
NZD/USD and EUR/CHF has similar setups, but are totally unrelated pairs.
The only difference between both analysis is that:
Support level (0.61347) is not as strong as the support level of the EUR/CHF in our previous analysis, and the reason for this is because:
If you check back in time (2020), price broke support level 0.61347, and slipped over 600 pips, but in 2015, the support level held price.
This week, if we see a reversal candlestick around the present resistance zone, then expect price to most likely revisit support level 0.61347, but a breakout would mean the bulls are dominating, and our next possible resistance level would be 0.62519
This week we have two quality setups on the 4 hour time frame, hopefully as the week unfolds, I will update you.
What say you?
Traders who are interested in joining our FREE trading group on Telegram, where trade ideas and trade-related topics are discussed, which could assist your trading career while being infected by positive vibes
hit us on Pip Crafters