Hello traders,
let’s hit them charts:
1. AUD/USD

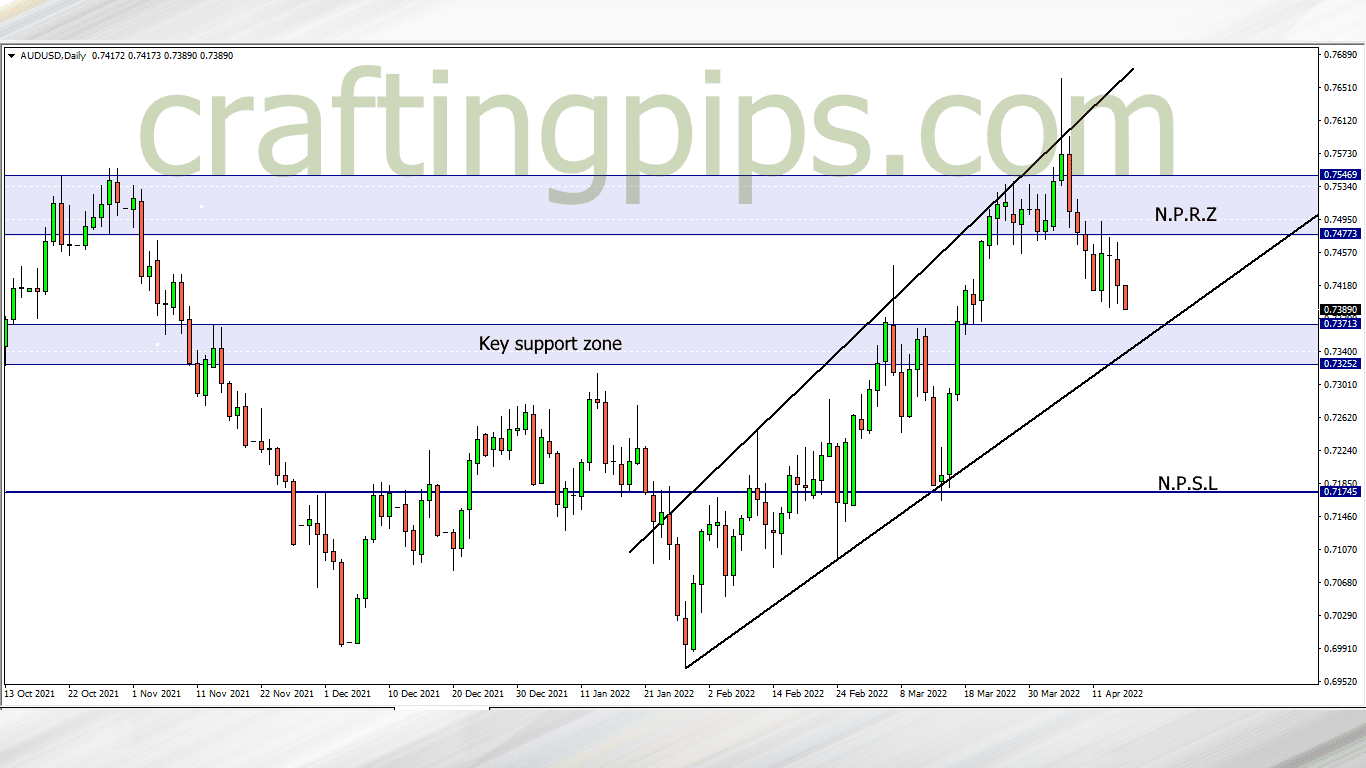
An ascending expanding channel can be seen on the daily time frame of the AUD/USD.
How price sets on the key support zone is what we should be interested in this week. If the bears break through the key support zone, then support level 0.71747 will most likely be price next bus stop.
If sellers lose steam after hitting the key support zone, and we do get a bullish confirmation, then price may revisit the previous resistance zone
2. NZD/USD

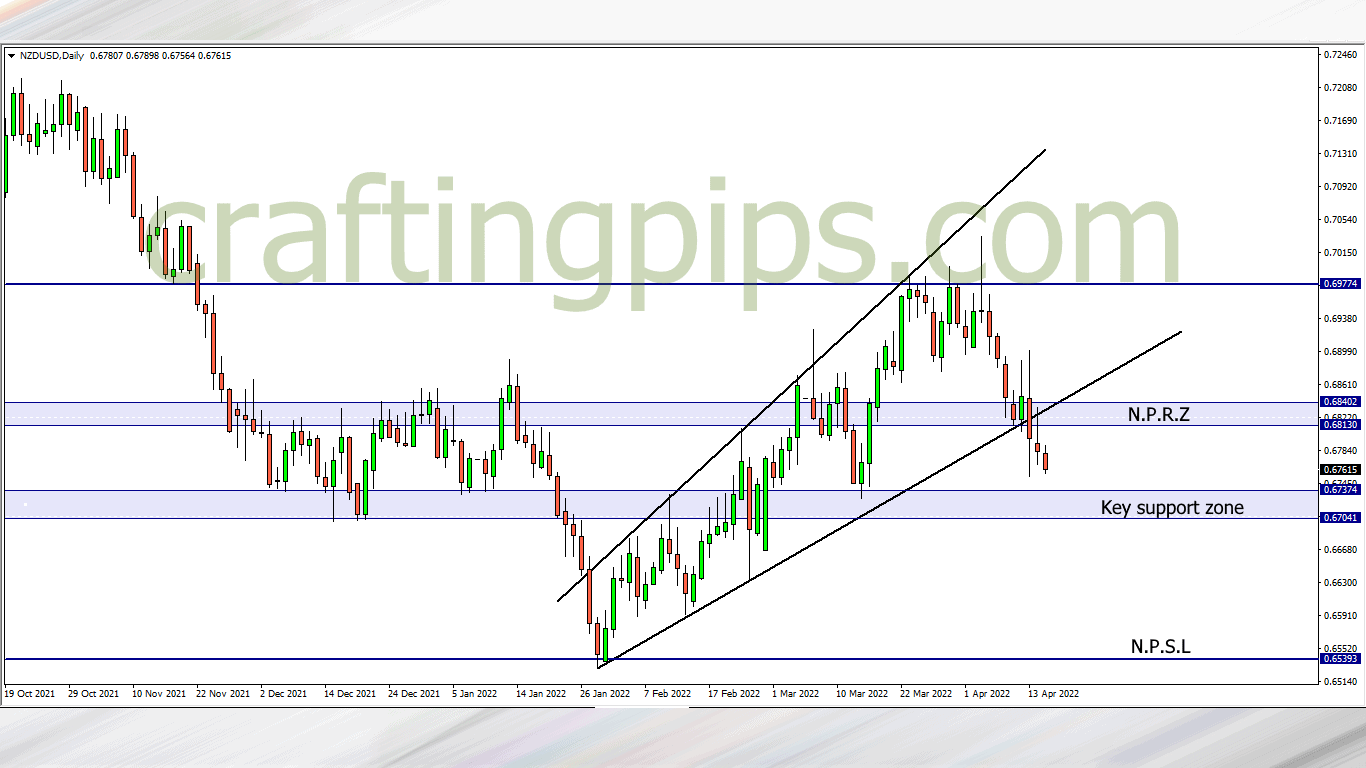
Price has broken out of an ascending channel on the NZD/USD and is about to hit a key support zone.
If a reversal occurs afterward, price will most likely revisit the previous resistance zone, and if the bears continue their campaign and the present support zone is broken, 0.65377 will most likely be the next possible support level
3. GBP/JPY

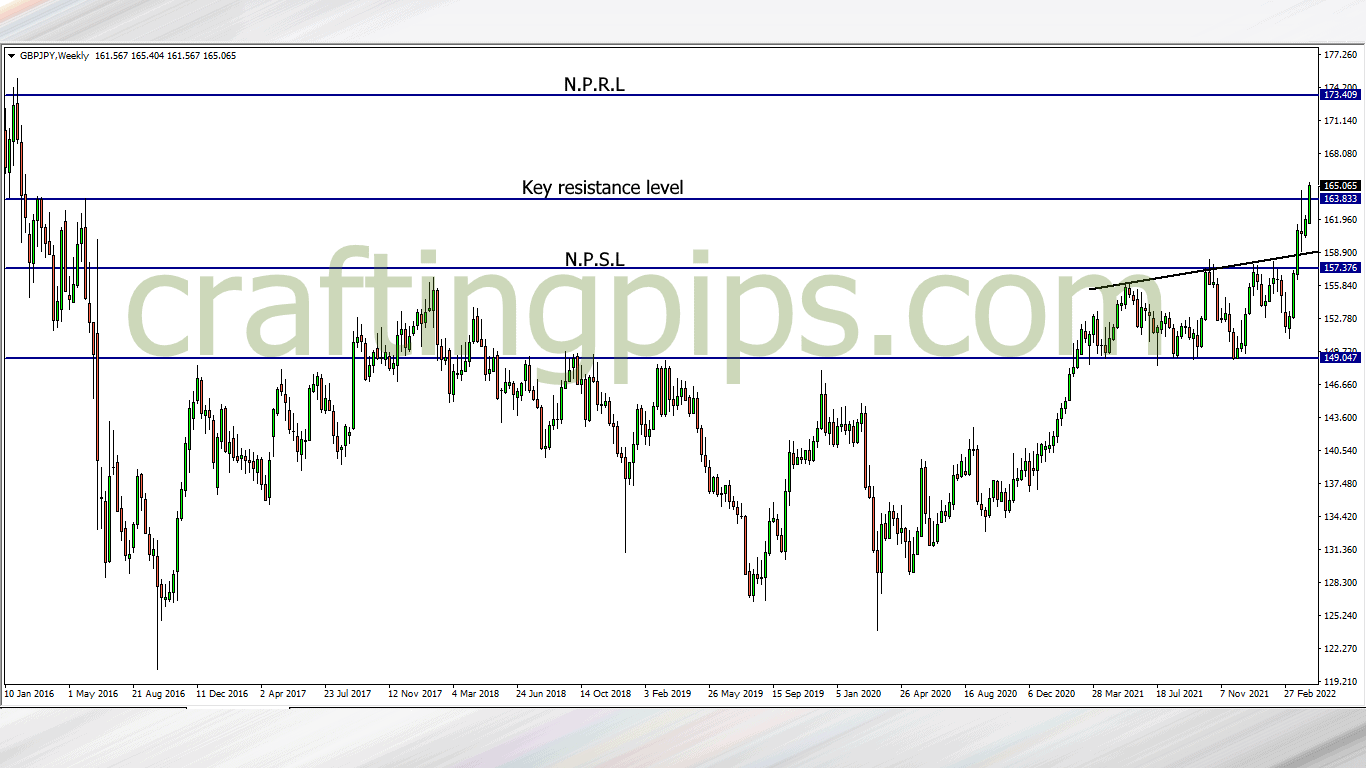
After GBP/JPY broke out of the ascending trendline which served as a key resistance level, the bulls have been aggressively bullish.
Presently price has partially broken resistance level 163.691. The last time price broke this level was over 8 years ago. If we do get a bullish trend confirmation this week, we may see price move another 700 pip plus in the next 3-5 weeks to the next possible resistance level (173.432)
4. XAU/USD

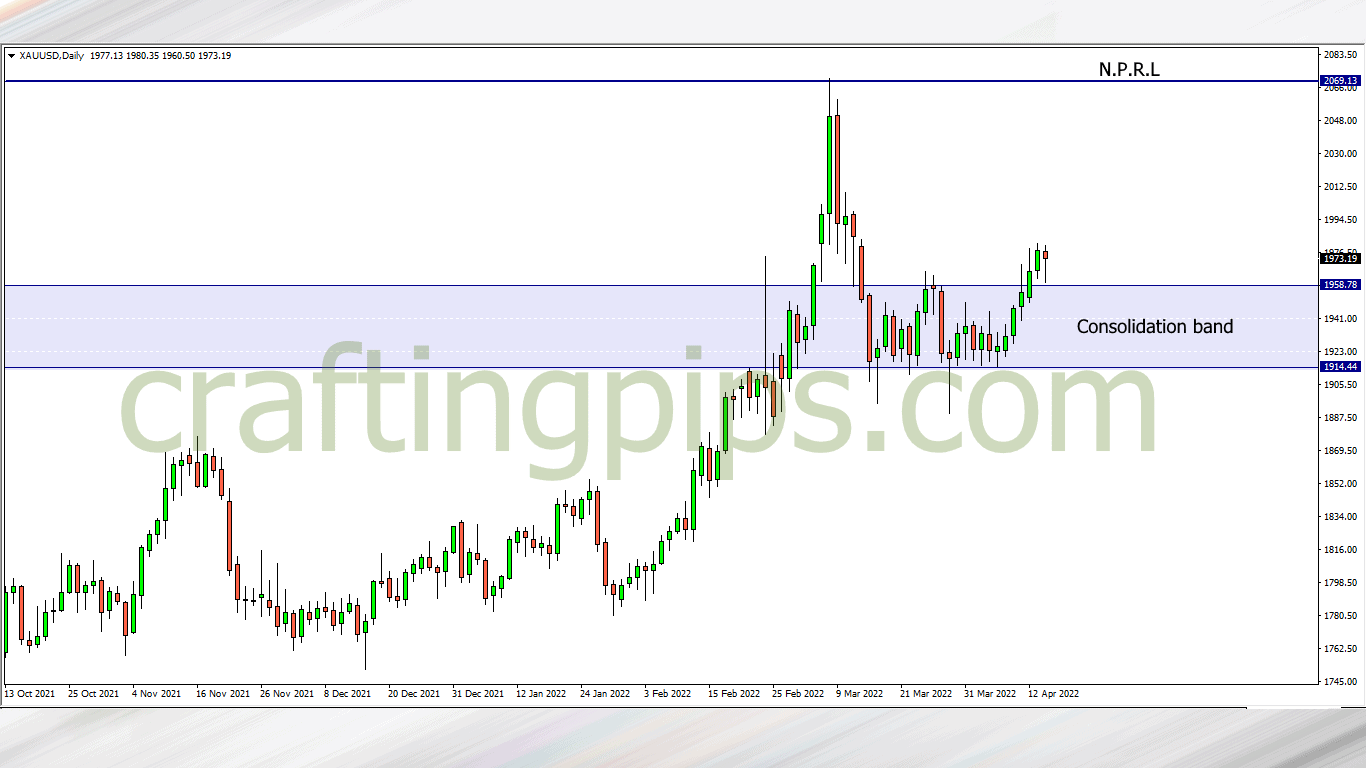
Gold is still looking bullish. This week we may see over 900 pip move to the next key resistance level that was last visited in March this year.
What say you?
Traders who are interested in joining our FREE trading group on Telegram, where trade ideas and trade-related topics are discussed, which could assist your trading career while being infected by positive vibes
hit us on Pip Crafters