Good day traders,
So, It’s the last week before Christmas and this week should be my last trading week for the year 2018. However, that doesn’t mean, we won’t offer our services in providing daily and weekly setups when spotted.
Traders, let’s hit the market…
1. GBP/JPY
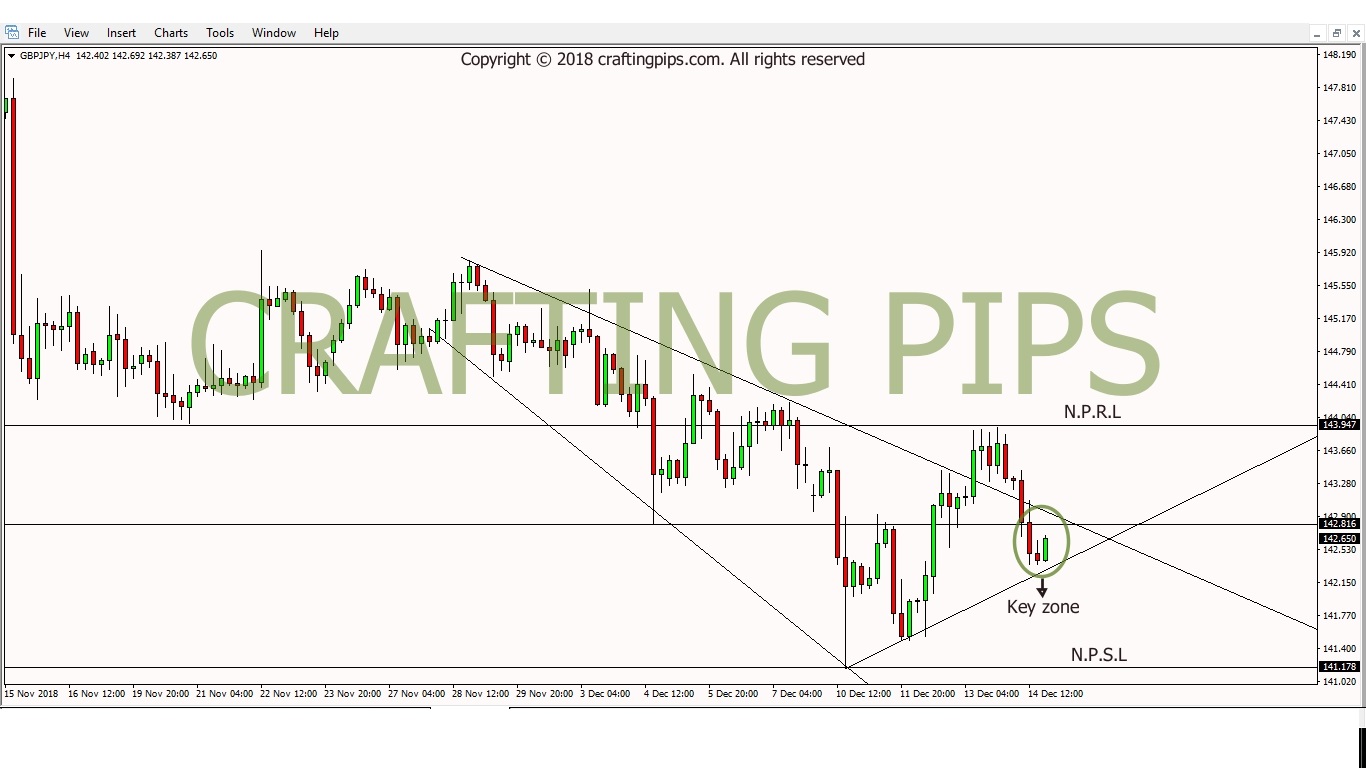
GBP/JPY on the 4 hours chart closed with a bearish reversal after hitting resistance level 143.947.
The bears were so strong that a previous breakout from a descending channel was revisited and broken. Presently price is within the descending channel and currently resting on an ascending support level (142.376).
If this level is broken, we should see price drop below level 141.676. If you ask me about the market becoming bullish, based on the current support level?
I really can’t say, simply because there are two strong resistance levels(142.816 & 142.919) for price to break out from, before even attempting to go bullish.
In my opinion, it would take greater effort for price to go heavily bullish, outside resistance level (142.919). However, nothing is impossible in the world of forex. Like I always say, wait for confirmation before taking this trade.
2. NZD/JPY
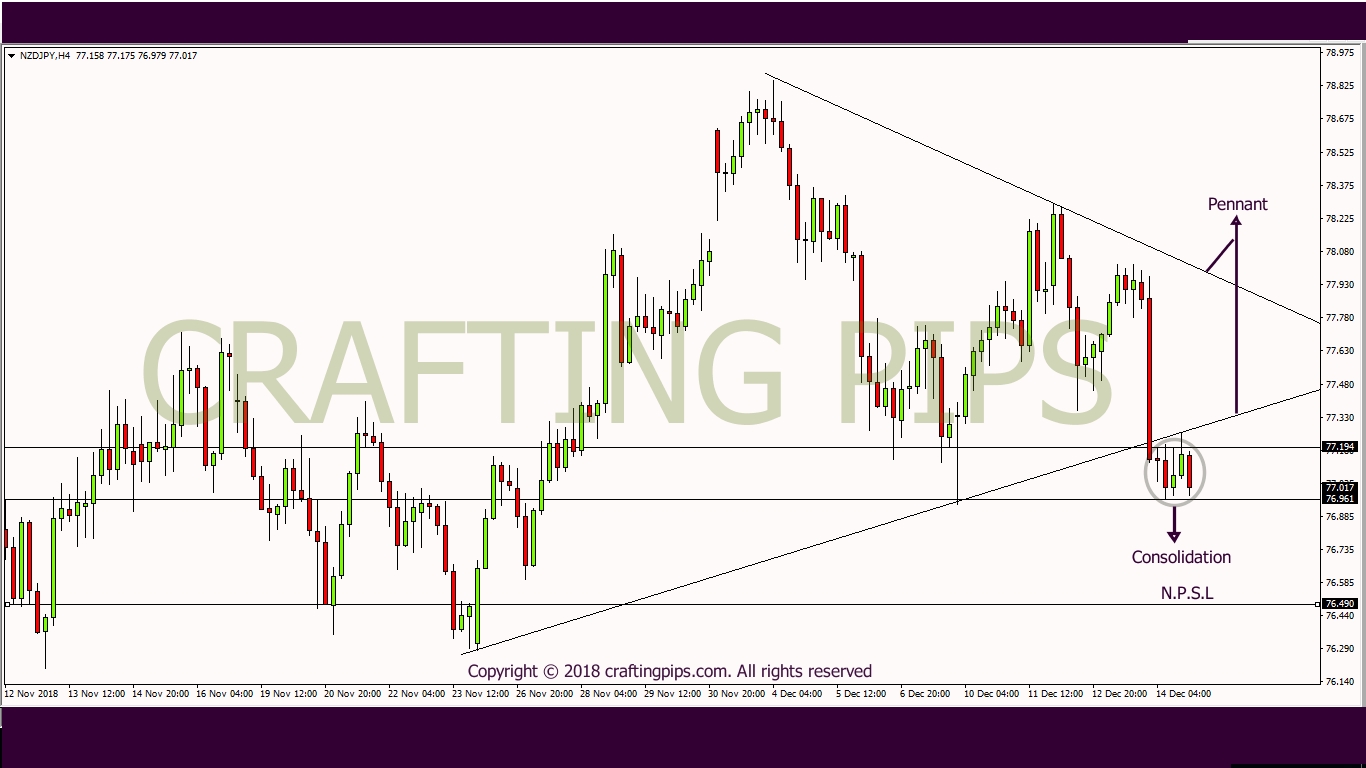
NZD/JPY on the 4 hours chart looks good.
After the bearish breakout (77.210) from the pennant, price spent the rest of Friday forming a consolidation between level 77.194 & 76.959. A breakout from the present support level should take price to the next possible support level (76.490).
A bullish breakout through the pennant should encourage the bulls to take price to the next resistance level (77.665).
3. CHF/JPY
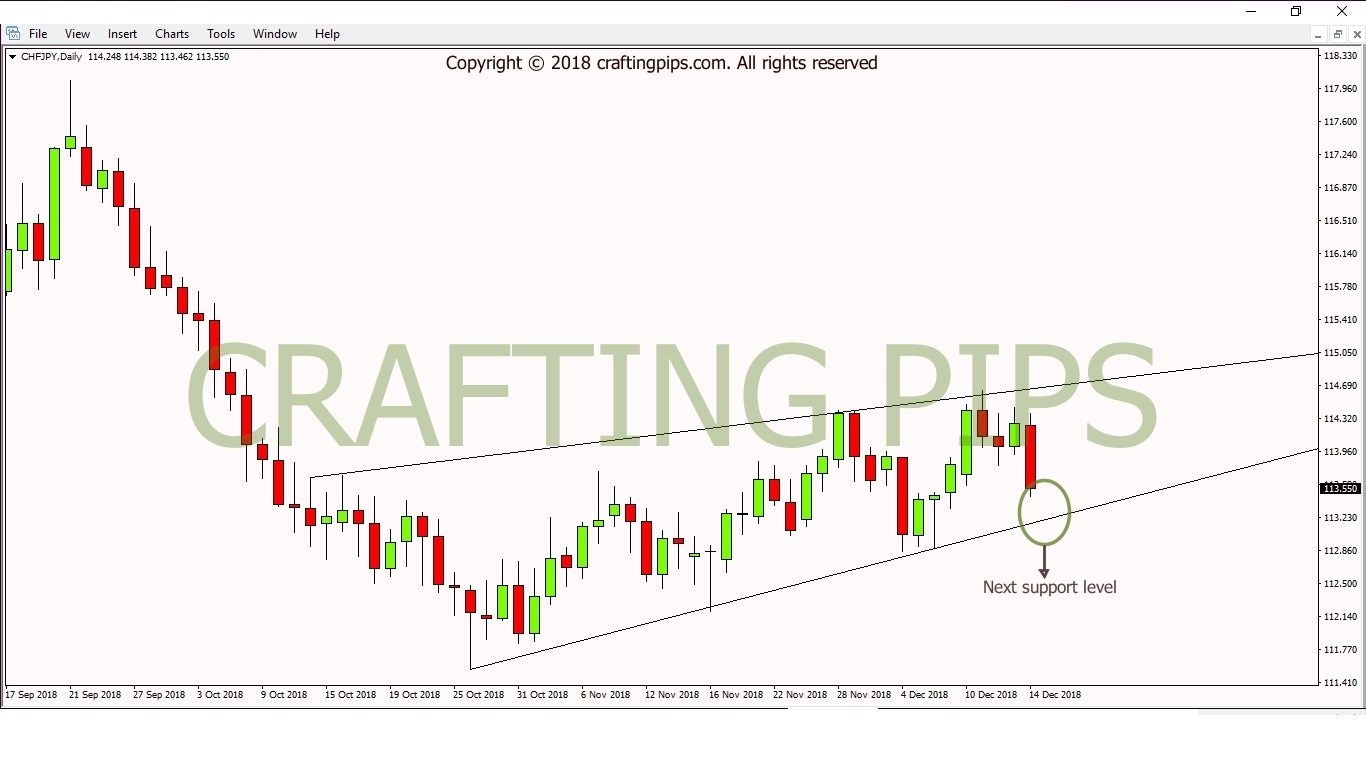
CHF/JPY is locked within an ascending pennant on the daily chart.
Two things could happen when price hits support level 113.223.
- A BREAKOUT – which could take price to the next support level 111.568 or
- A BULLISH REVERSAL – which could send price above level 114.227
4. USD/CAD
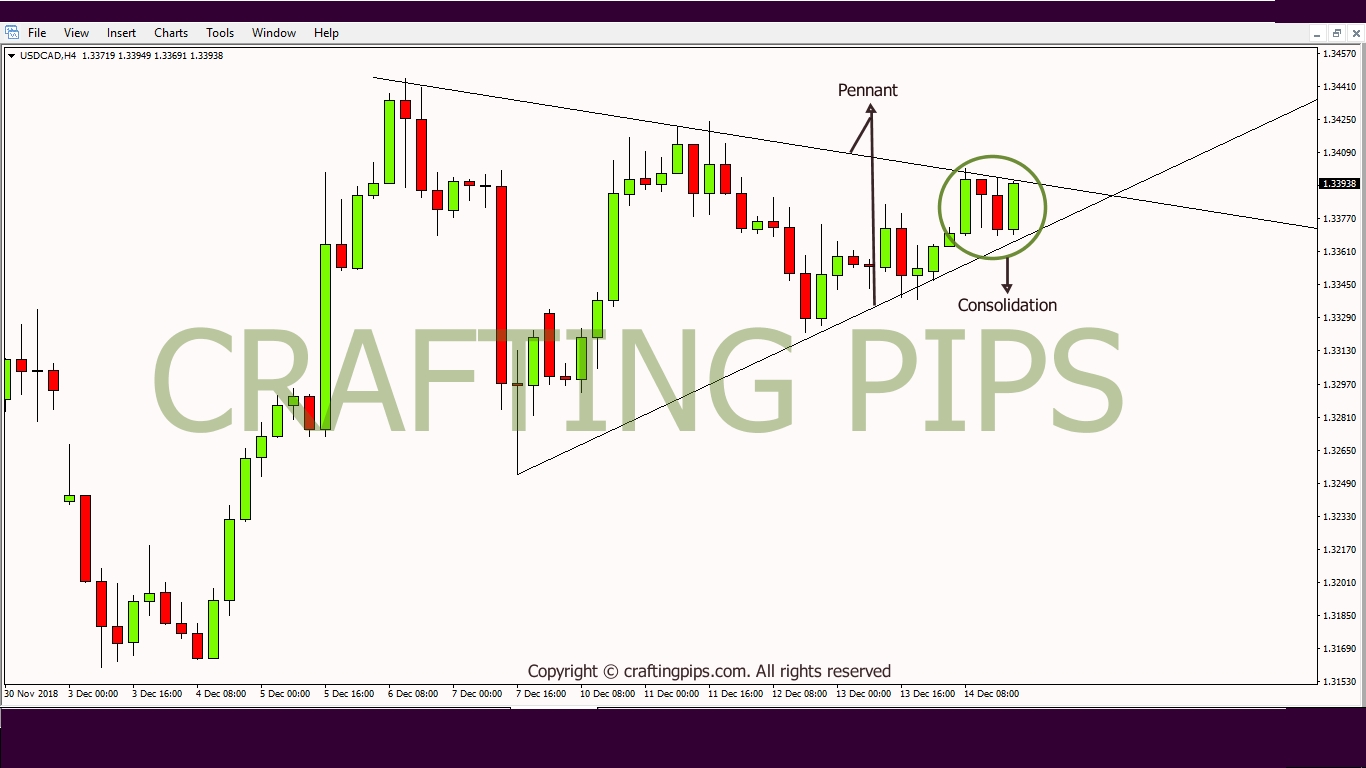
USD/CAD on the 4 hours chart has formed a beautiful pennant.
Price formed a consolidation within the tail end of the pennant. A breakout from resistance level 1.33947 should take price to the next resistance level (1.34431).
A bearish breakout from the pennant should take price to the next support level (1.33211).
NOTE: In each of these setups, ensure a good confirmation of your system guides you and a sound money management shields your account. It’s a Monday and there is a reason why I call it Risky Monday’s
That said, do subscribe to our weekly and daily analysis, let us also have your comment on what your views on the market is and you could also join our Facebook community through the facebook icon below.
![]()
![]()
![]()
![]()
![]()
![]()