Good morning fellow traders,
We have finally come to the last week of the month of November. I guess the holiday season is approaching faster than most of us traders are willing to accept.
Personally I haven’t decided when to stop trading for the year. I am still considering mid December.
When do you plan on taking a break?
Anyway, as we ponder upon that, let’s head right into our charts and see if we could make the last week of November a memorable one.
1. EUR/USD
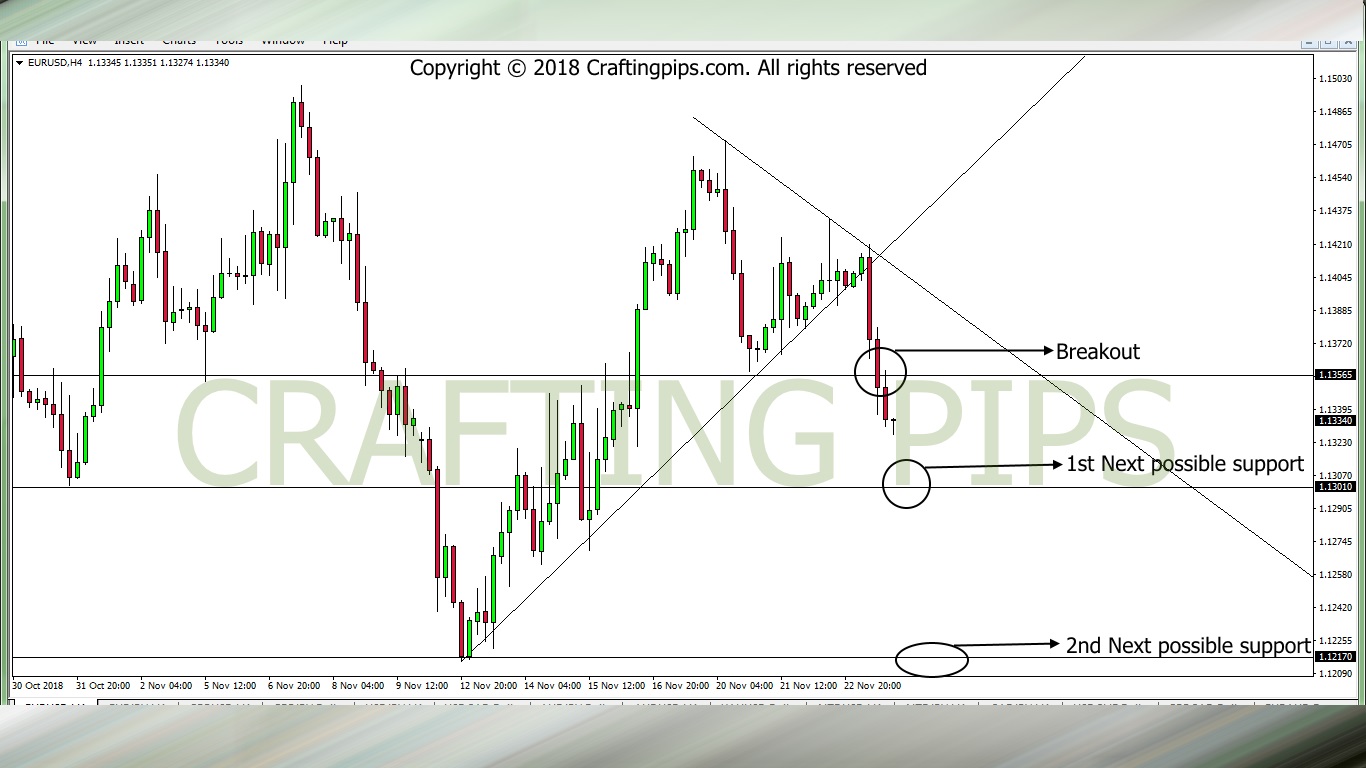
EUR/USD closed with a highly bearish candlestick on Friday. This created an opportunity for us on the 4 hours chart.
An ascending support level was broken and the bears broke yet another support level at 1.13565. In my opinion, there are two ways to go about this trade, and it all depends on the type of trader you are.
For the conservative traders, you could wait for price to hit the next support level (1.3010) before taking a trade, which may either be a reversal back to level 1.13565 or continue with another breakout to the second possible support level (1.12170).
For the less conservative traders, if the market doesn’t opens with a gap that could affect the current setup, you could wait for a slight pull-back, before taking a sell to the next possible support level (1.3010). Afterwards you could apply the conservative trader’s approach described above.
2. AUD/USD
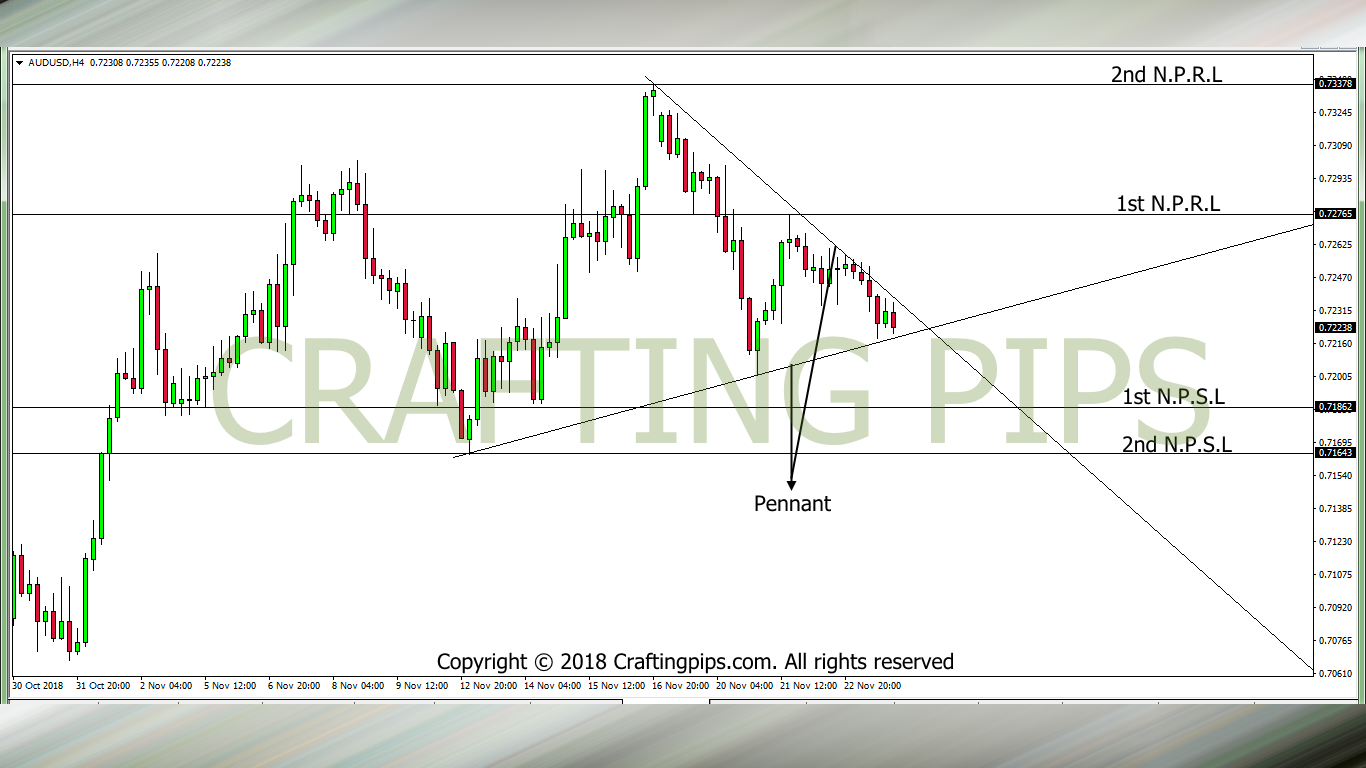
Before we begin our analysis of AUD/USD, let us properly explain the acronyms on the our charts.
N.P.R.L – Next Possible Resistance Level
N.P.S.L – Next Possible Support Level
Don’t worry about where I got them from, I actually made them up (lol),
Back to our analysis…
On the daily chart, AUD/USD closed with a bearish candlestick, however, this is not to say that there is a high probability that the bears would continue this week.
However, on the 4 hours chart, there seem to be a great setup. Price is currently locked within a pennant and a breakout from either the resistance or support level, will take price to any of the marked resistance or support levels.
3. EUR/CHF
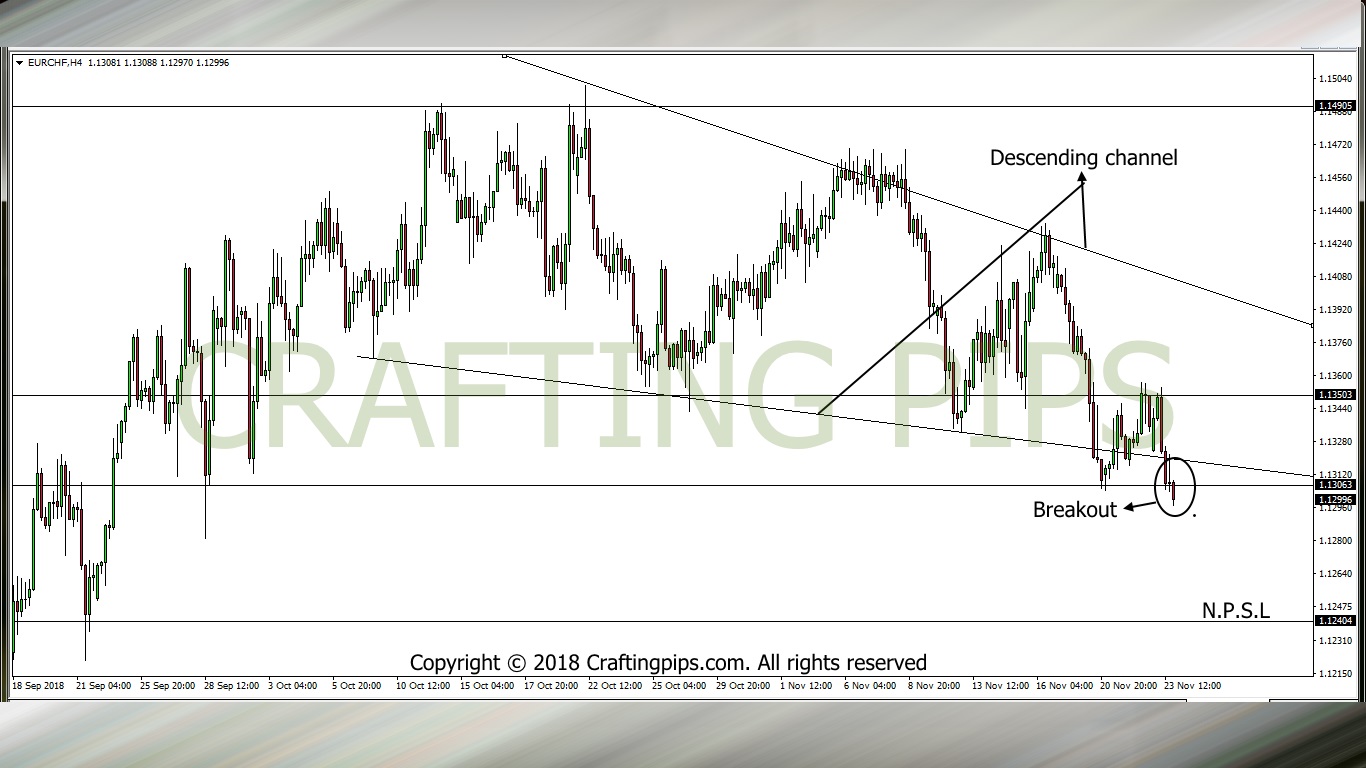
EUR/CHF has another interesting setup. On Friday the daily chart closed with a highly bearish candlestick.
On the 4 hours chart, price broke two support levels (Descending channel’s support level and a horizontal support level). If this flow is not disrupted by the ambiguity of Monday’s market, we should see price on a continuous bearish move to its next support level 1.12404.
NOTE: Monday’s market in most cases could be highly unpredictable, and if you notice, each of the analysis given, was from a 4 hours time frame (which could be a less stable time frame for a crazy Monday).
If any of the setups appeal to you, exercise enough caution to wait for the market to settle down before trading.
Do have a pip-full last week of November.
![]()
![]()
![]()
![]()
![]()
![]()