Hello traders,
let’s hit them charts:
1. CAD/JPY

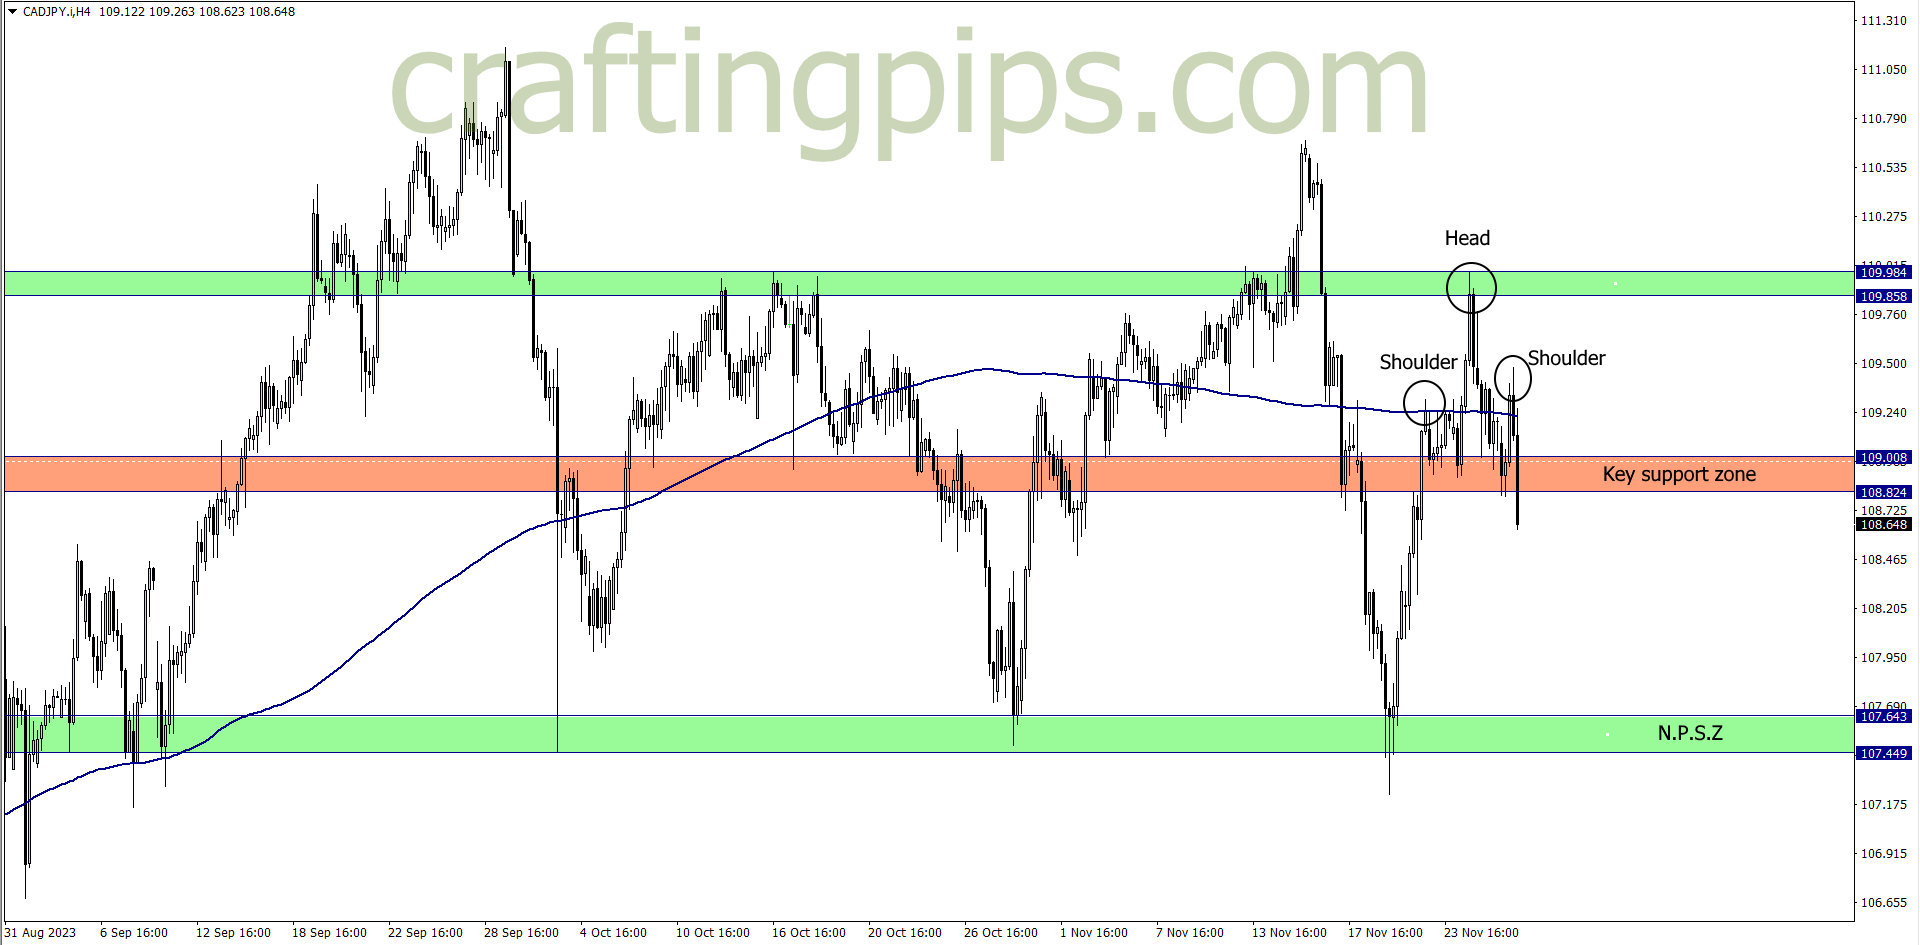
Last week, after price reached 109.972 resistance level, the bulls fizzled out and price dropped.
This week, I was thinking that the bulls may gather momentum once again, and try to break last week’s resistance level (109.972), but the exact opposite is happening.
On the 4-hour time frame, we can see a classical head and shoulders formation and the neckline or support zone convincingly broken. For now, it may be too early to sell, so I will wait for the close of the daily time frame before I engage this pair
If my bearish bias is supported, then we shall join sellers to ride price to NPSZ.
What say you?
NOTE:
Check out our mouth-watering discounts on any of the proprietary firm’s challenges:
-
THE FUNDED TRADER: (Use the coupon code: THE0CRAFTER)
- BESPOKE FUNDING PROGRAMME
- FUNDED ENGINEER
- BLUE GUARDIAN (Use the coupon code: CRAFTER)
- GOAT FUNDED
- LARK FUNDING
- SKILLED FUNDED TRADER
- MAVEN TRADING
- MY FLASH FUNDING (Use the coupon code: “FILLIPO” for a -25% discount)
- THE5ERS