Hello traders,
Let’s hit them charts:
1. USD/JPY
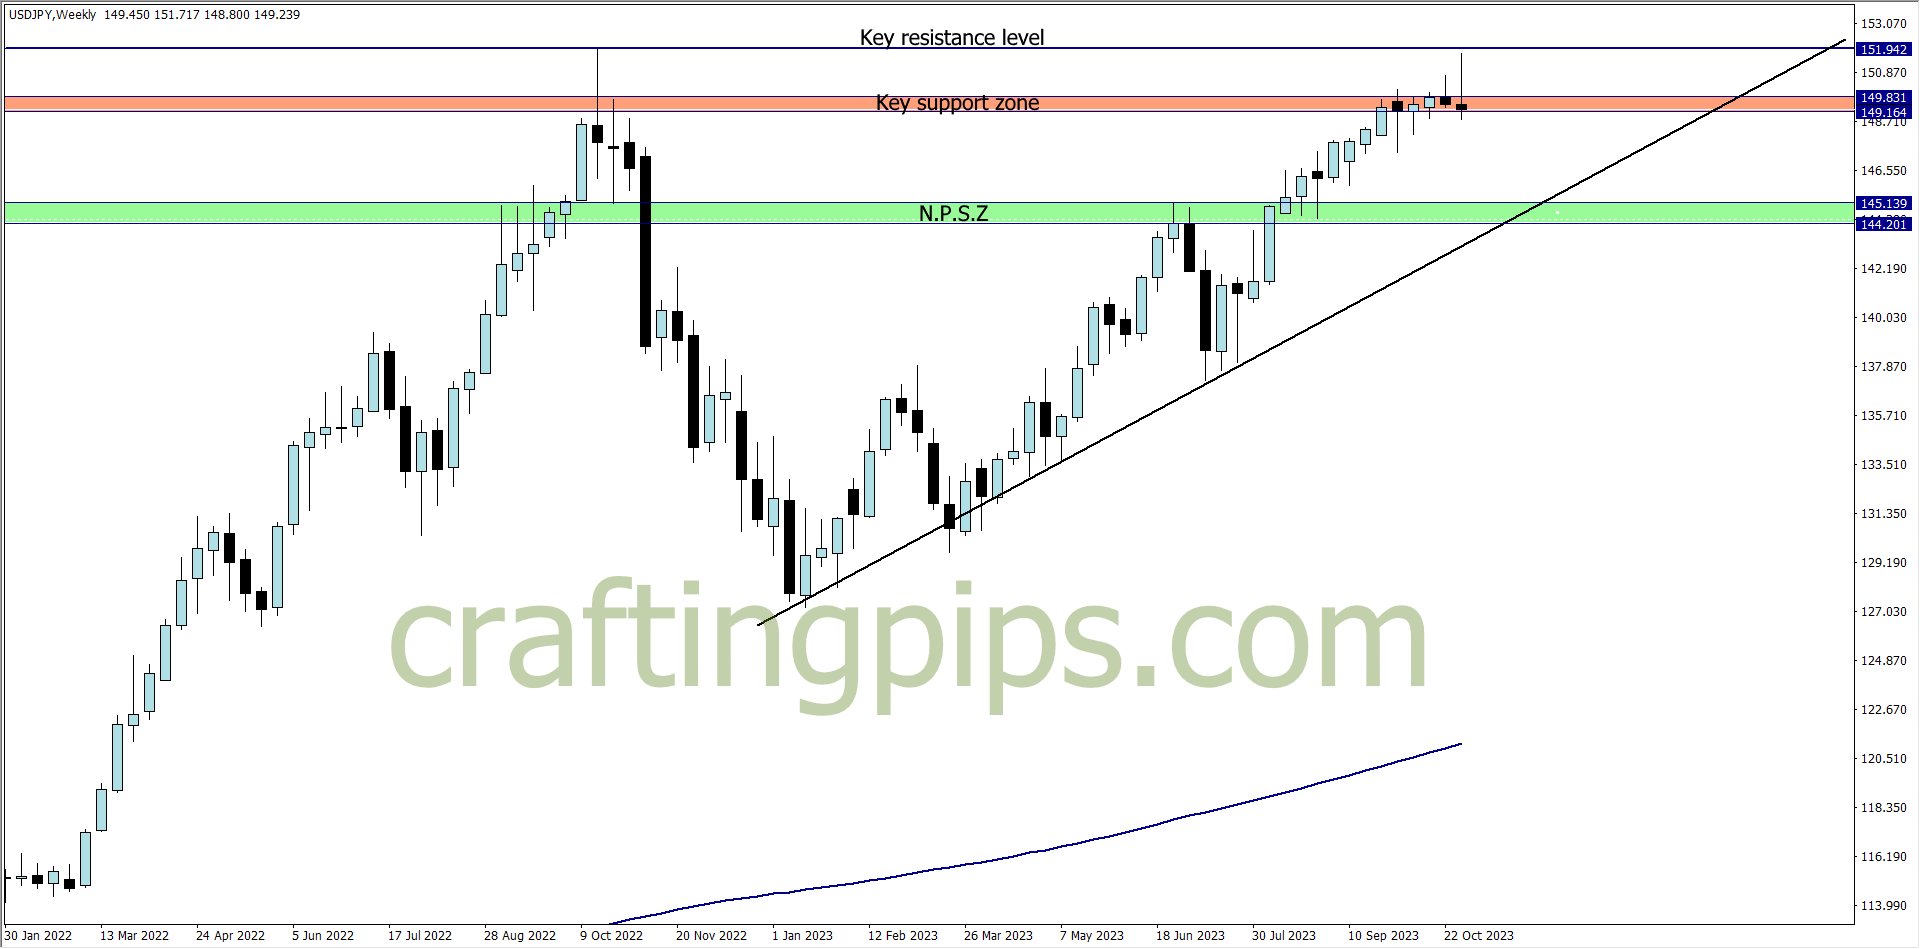
On the weekly time frame of the USD/JPY, we can see a bearish pullback.
Resistance level 151.942 is the highest level price has ever reached in over 20 years, and it seems to also be a formidable level for the bulls to break.
This week, there is a huge possibility that we may see a 200 – 400 pips fall.
2. NZD/USD
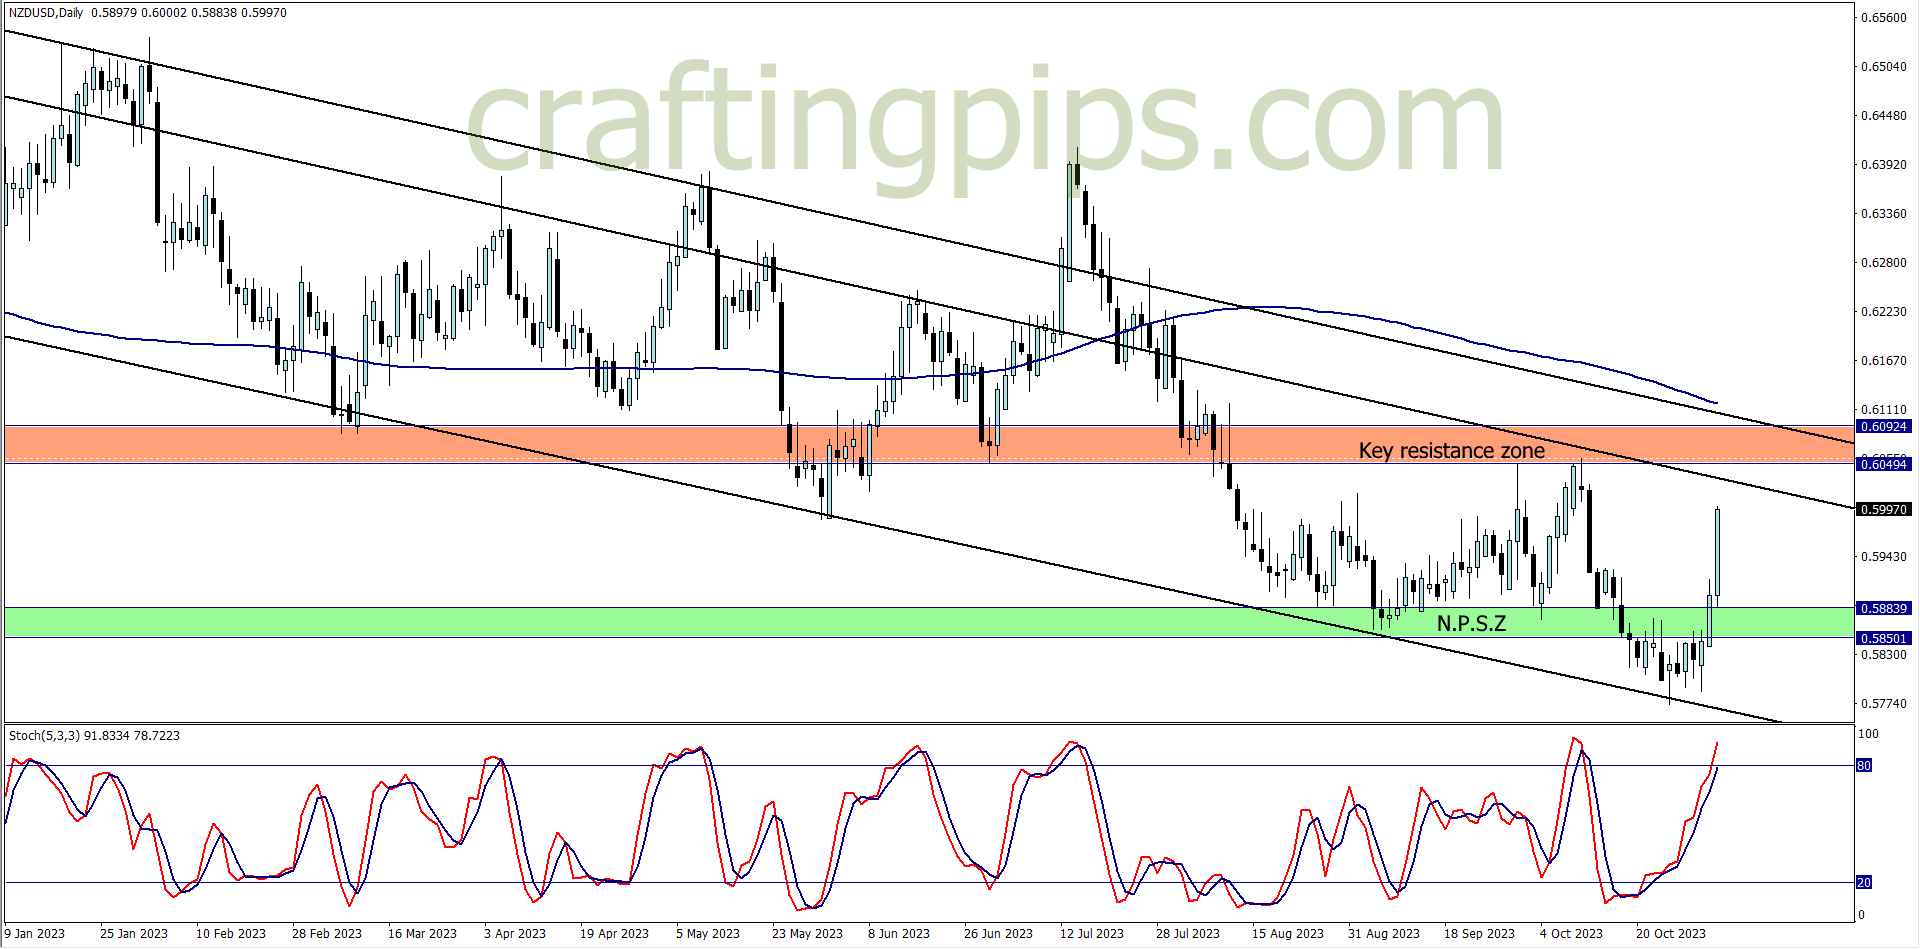
NZD/USD is looking good.
NZD/USD formed a new low on Friday before a strong reversal. Presently, we can see a descending channel formed on the daily time frame and price approaching a key resistance zone
If we do get a reversal candlestick pattern within the week, we could see a 150 to 170 pips fall
3. EUR/CHF
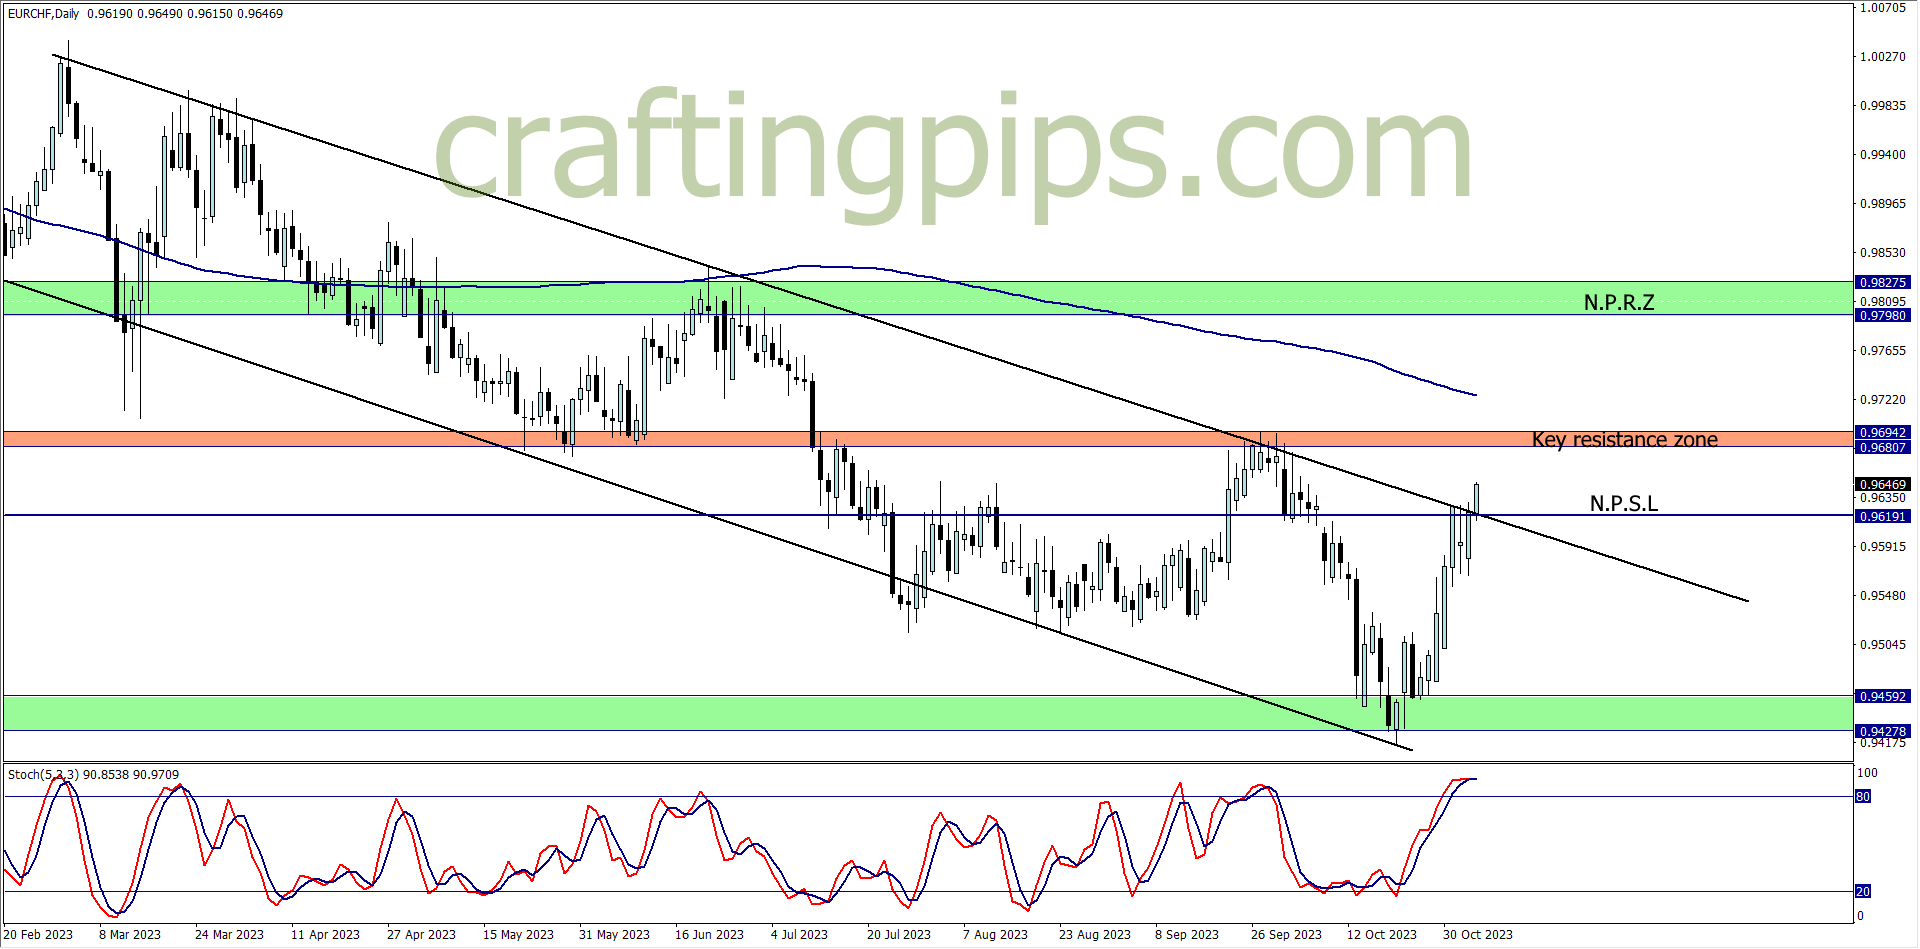
Last week, we saw an aggressive 0.96191 resistance level breakout on the EUR/CHF
This week, I will be waiting to see how price reacts to the key resistance zone. If we do get a reversal pattern, then I will be joining the sellers back to NPSL
What say you?
NOTE:
-
THE FUNDED TRADER: (Use the coupon code: THE0CRAFTER)
- BESPOKE FUNDING PROGRAMME
- FUNDED ENGINEER
- BLUE GUARDIAN (Use the coupon code: CRAFTER)
- GOAT FUNDED
- LARK FUNDING
- SKILLED FUNDED TRADER
- MAVEN TRADING
- MY FLASH FUNDING (Use the coupon code: “FILLIPO” for a -25% discount)
- THE5ERS