Hello traders,
let’s hit them charts:
1. USD/JPY
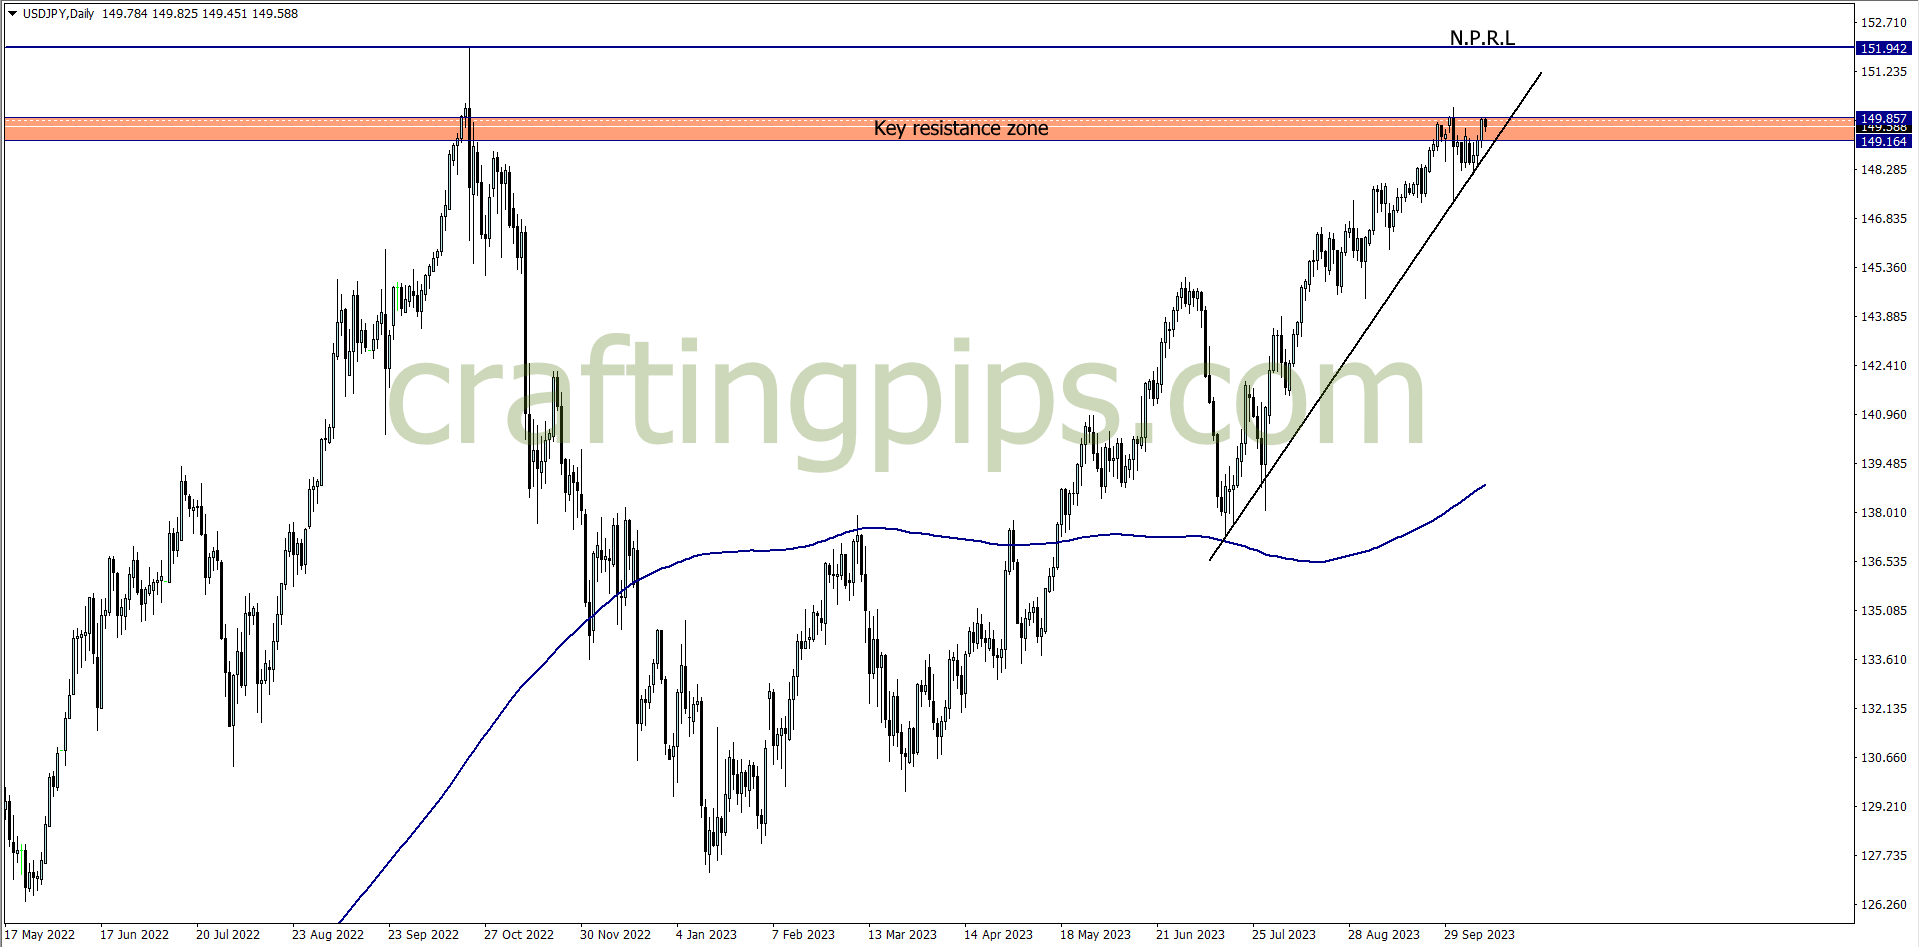
Last week the USD/JPY reversed from the previous week’s fall.
This has formed a higher low, and a breakout above the current resistance zone may mean buyers taking price to resistance level 151.942.
This week I will be waiting for a breakout above 151.942 on the daily time frame
2. GBP/CAD
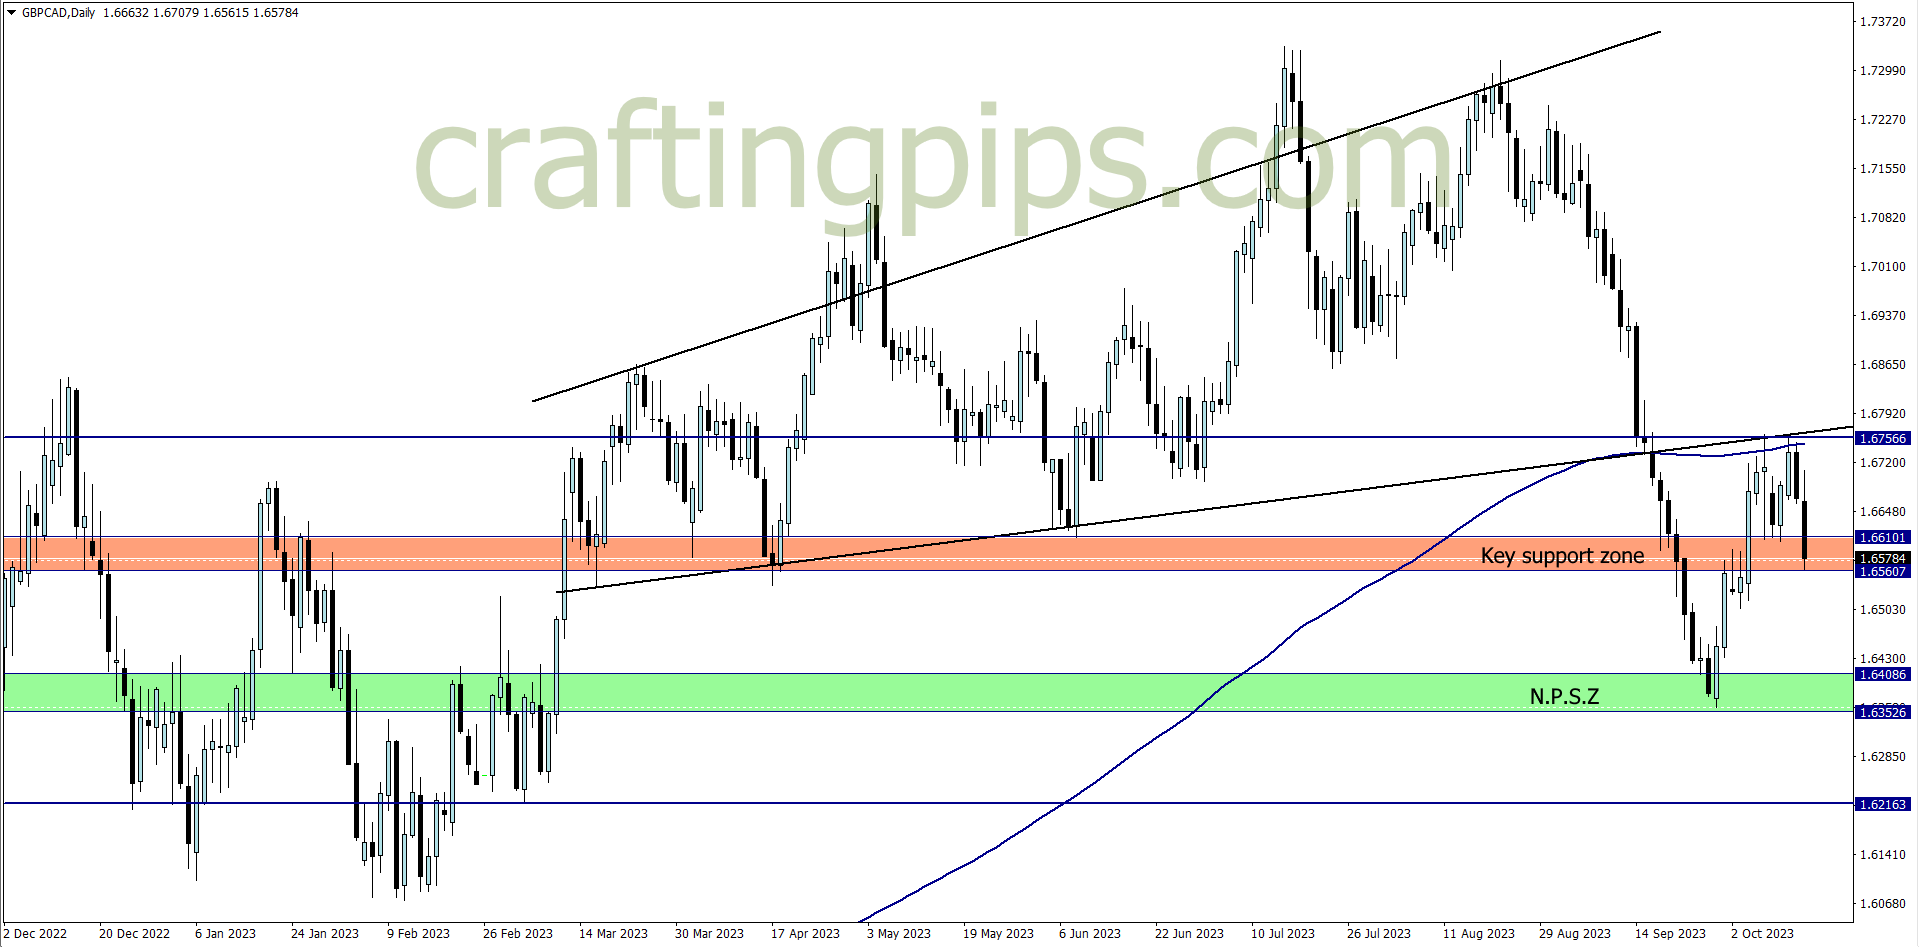
Last week, the GBP/CAD was one of my traded setups
The bears are in control, but it’s also important to note that price is at a key support zone. Meaning we could see price give us a minor/major pullback at this point, which I will not be interested in
I will be chilling to see if price breaks below the key support zone, and if that happens, I will be riding with them bears to NPSZ
3. GBP/CHF
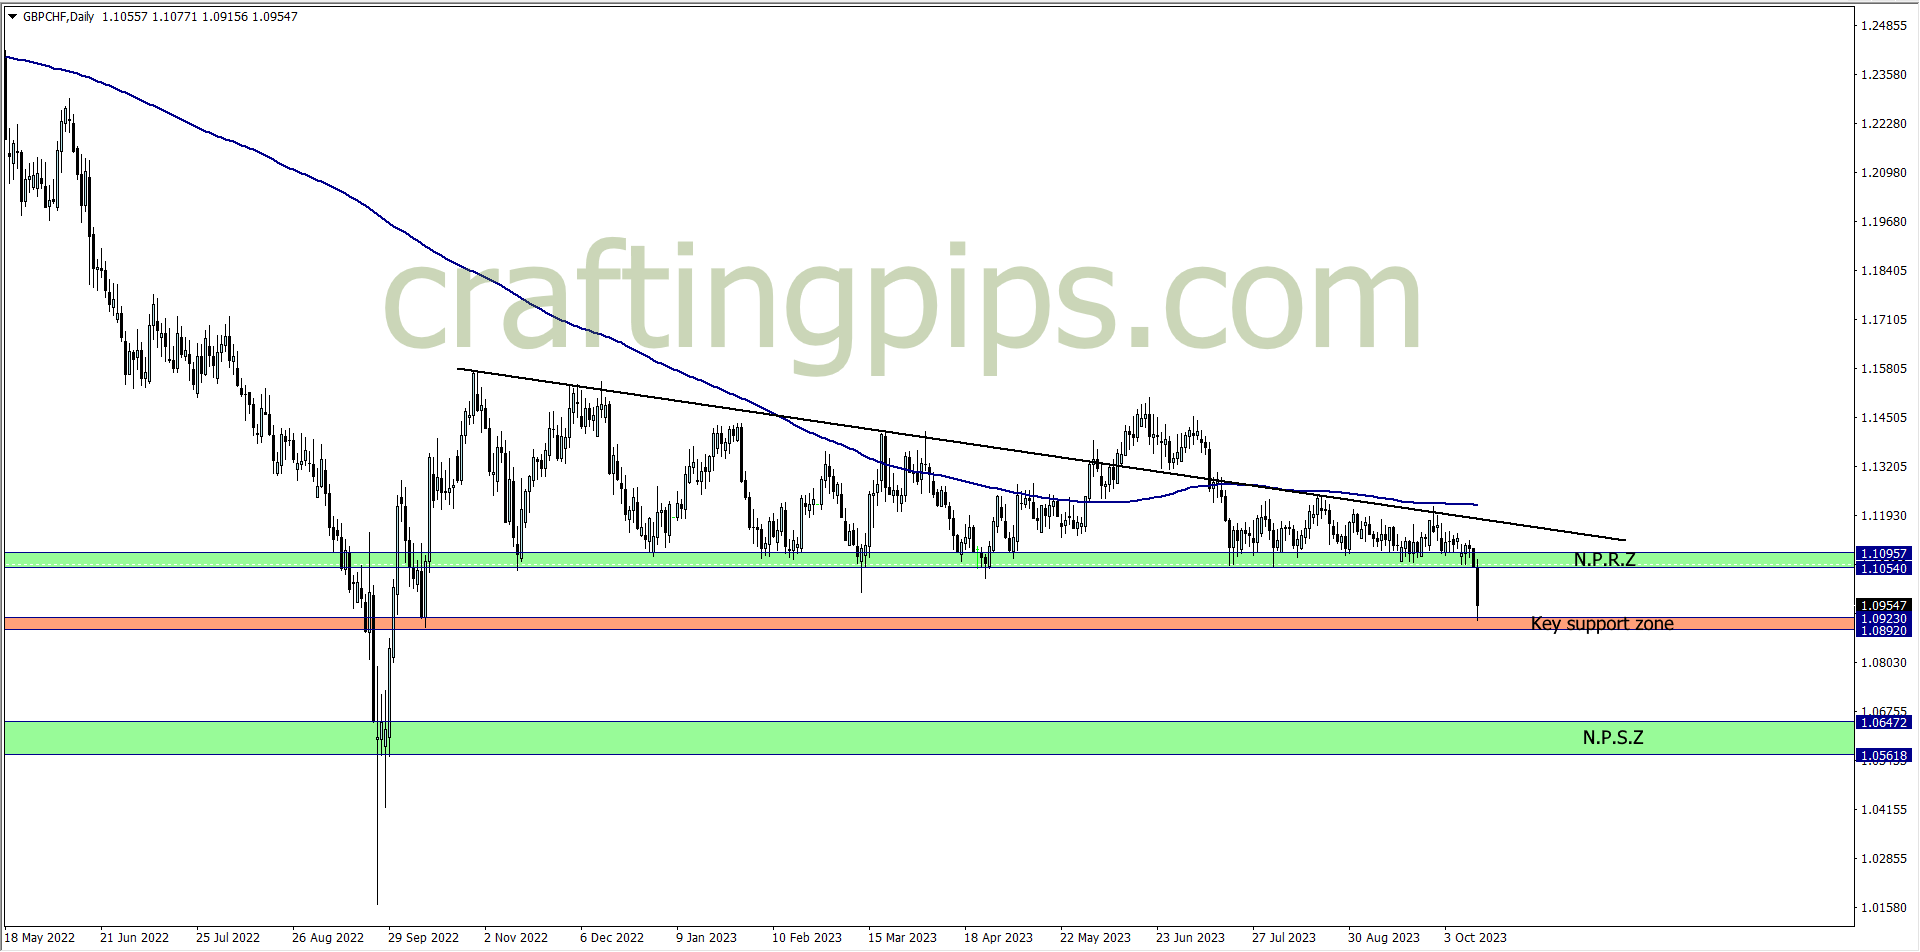
The GBP/CHF is one pair I am really keen on this week
Since October of 2022(12 months), NPRZ has held price, until last week when we saw a huge 135 pips drop to a key support zone.
This week we may most likely see a minor/major pullback before the key support zone gets broken (if it gets broken this week)
I may find a way of joining the pullback this week if risk/reward ratio is right
What say you?
-
THE FUNDED TRADER: (Use the coupon code: THE0CRAFTER)
- BESPOKE FUNDING PROGRAMME
- FUNDED ENGINEER
- BLUE GUARDIAN (Use the coupon code: CRAFTER)
- GOAT FUNDED
- LARK FUNDING
- SKILLED FUNDED TRADER
- MAVEN TRADING
- MY FLASH FUNDING (Use the coupon code: “FILLIPO” for a -25% discount)
- THE5ERS