Hello traders,
In today’s analysis I introduced the stochastic and bullish divergence as one of the confirmation tools. Let’s get to it
1. AUD/JPY
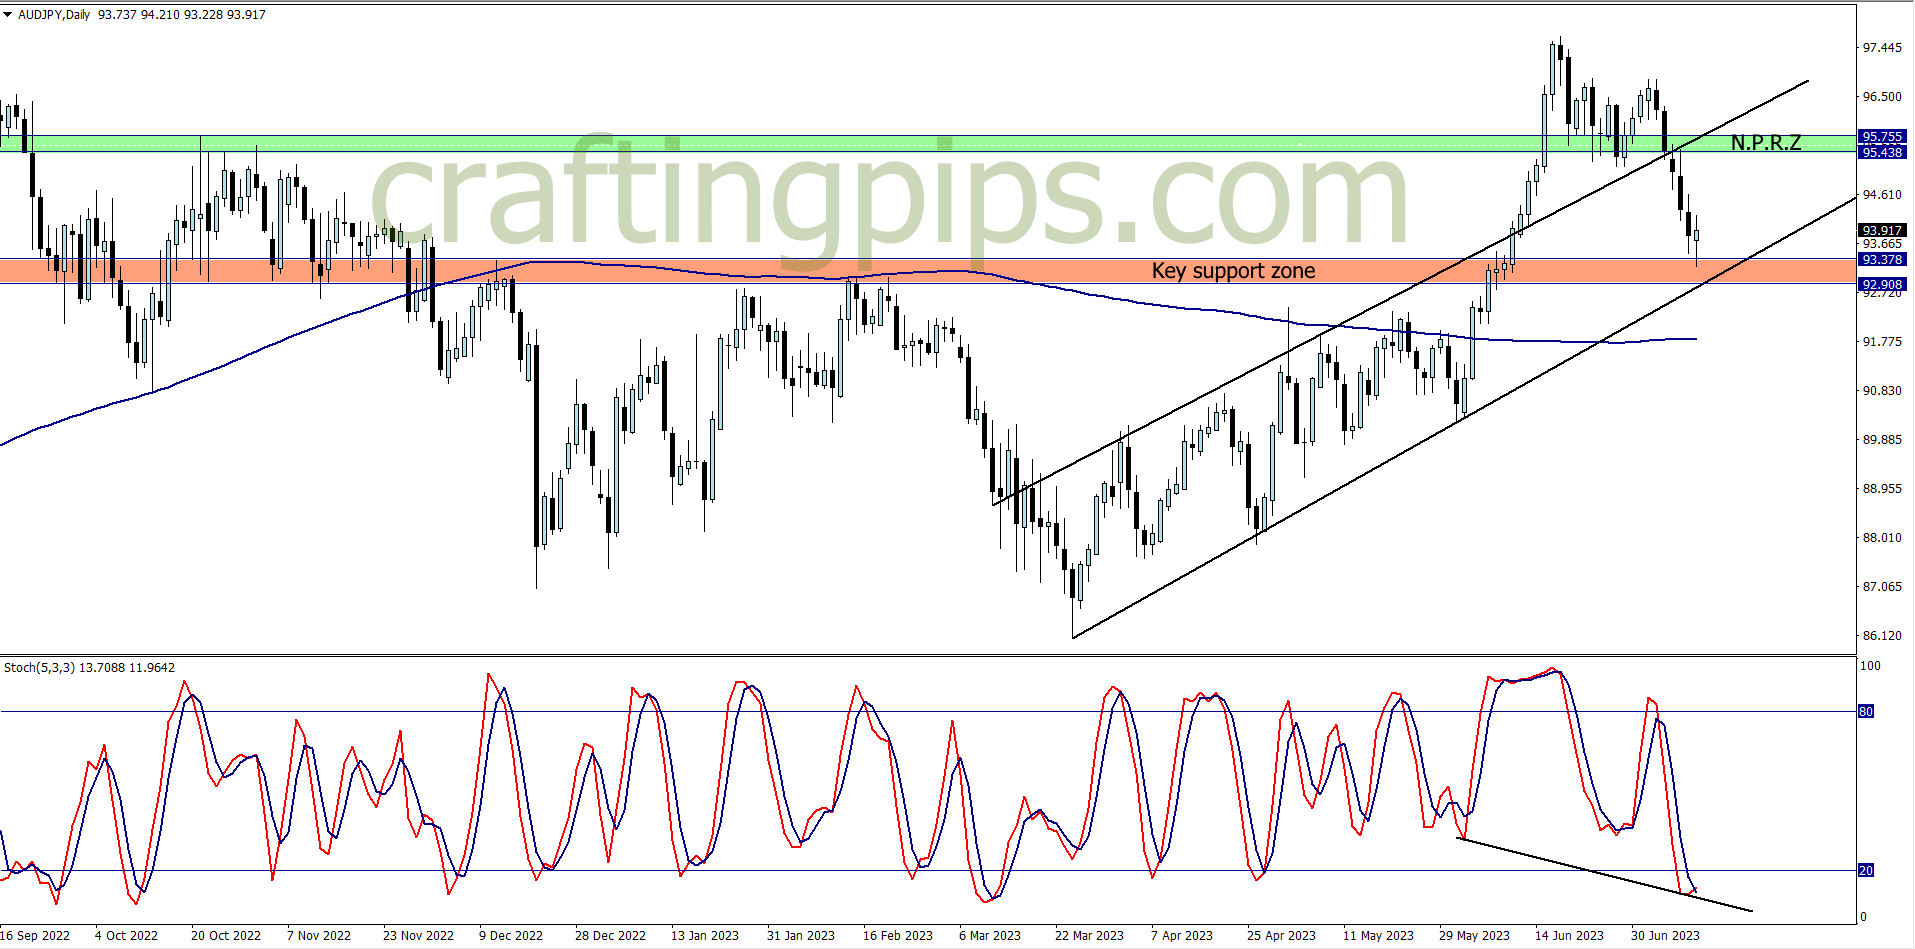
AUD/JPY is looking pretty resting above the 200 moving average, and above the key support zone.
The stochastic is also showing us a divergence which supports a possible bounce of price on the current support zone. If the daily candlestick closes with a doji, it would be an extra confirmation.
I will be waiting for the close of today’s candlestick (Wednesday daily candlestick) before making up my mind to join the bulls
2. CHF/JPY
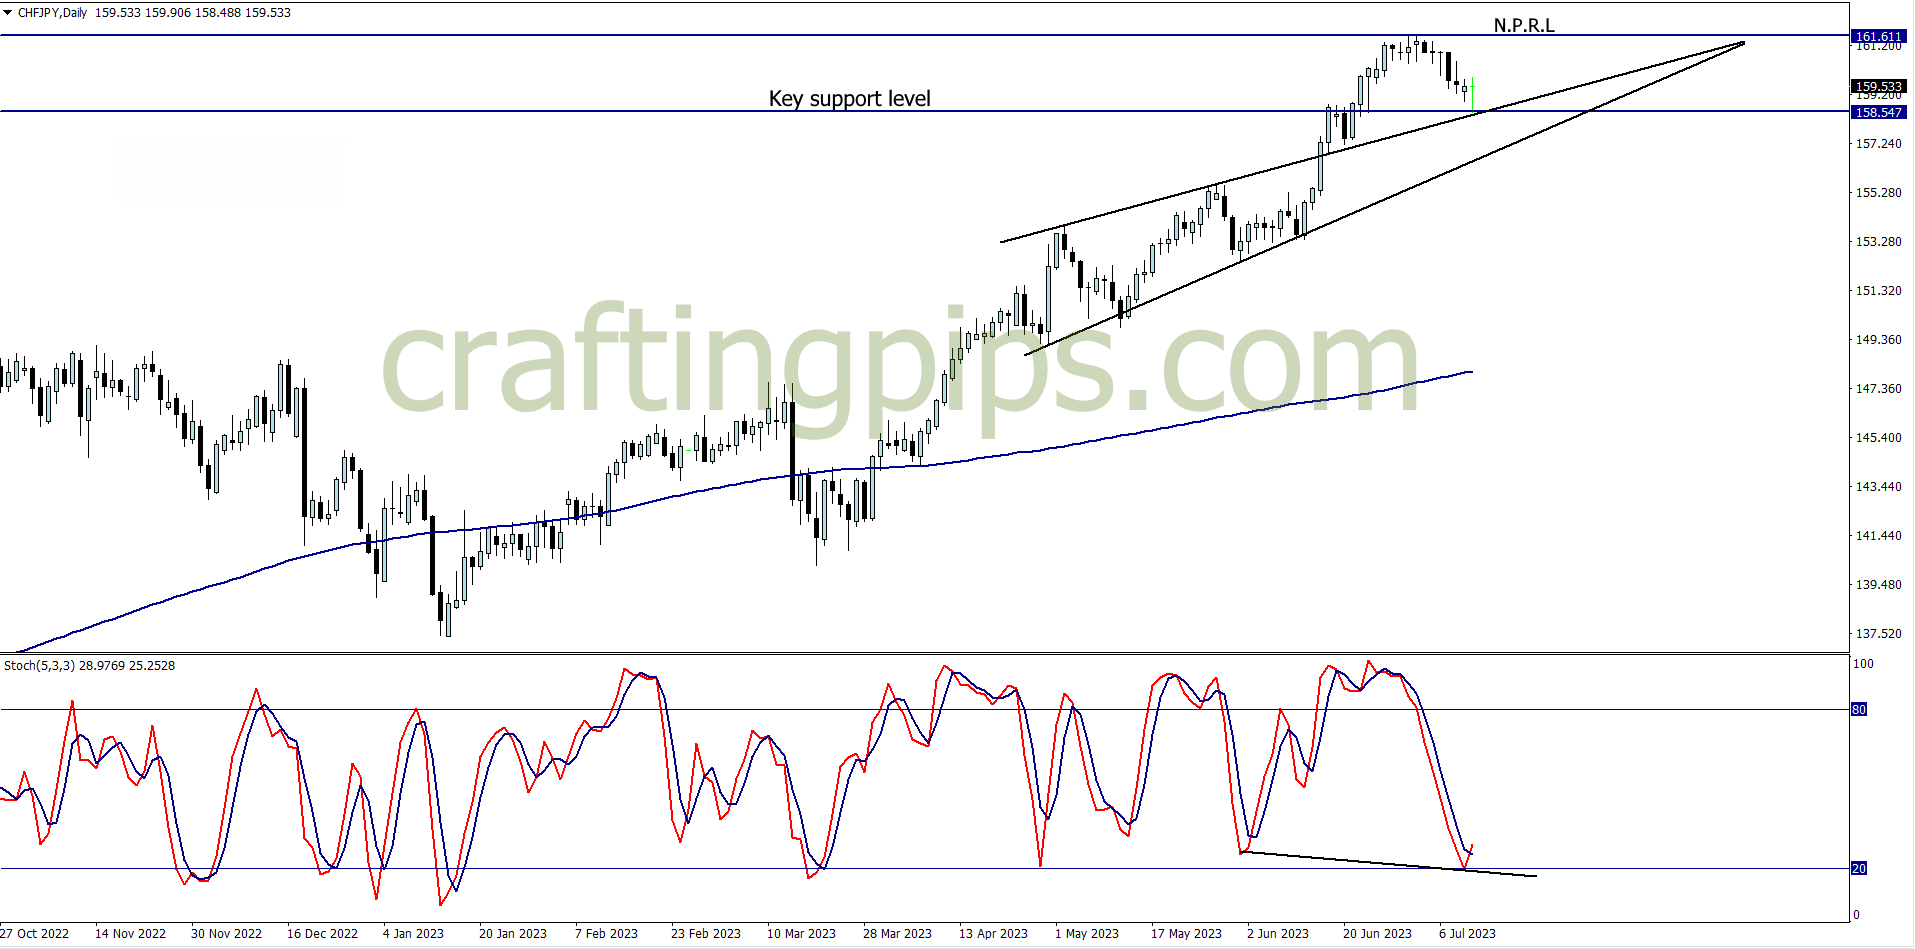
After price hit 161.611 (which is the highest price has been in over 20 years) on the CHF/JPY, we can see a pullback to a familiar support level (158.547)
Currently I see a dragonfly doji on the daily time frame, but it will be wise to wait till price closes. We can also see an over sold stochastic which suggests that there could be a possible reversal at the current support level.
If my bias plays out, price may return to the previous resistance level (161.611), and it won’t be a bad idea to enjoy over 180 pips upwards
What say you?
NOTE:
-
THE FUNDED TRADER: https://dashboard.thefundedtraderprogram.com/purchasechallenge-n/?sl=3322 (use the coupon code: THE0CRAFTER)
-
MY FUNDED FX: https://myfundedfx.tech/purchasechallenge/?sl=758
- BESPOKE FUNDING PROGRAMME: https://www.bespokefundingprogram.com/The_Crafter?ref=The_Crafter