Hello traders,
let’s hit the charts:
1. GBP/CAD
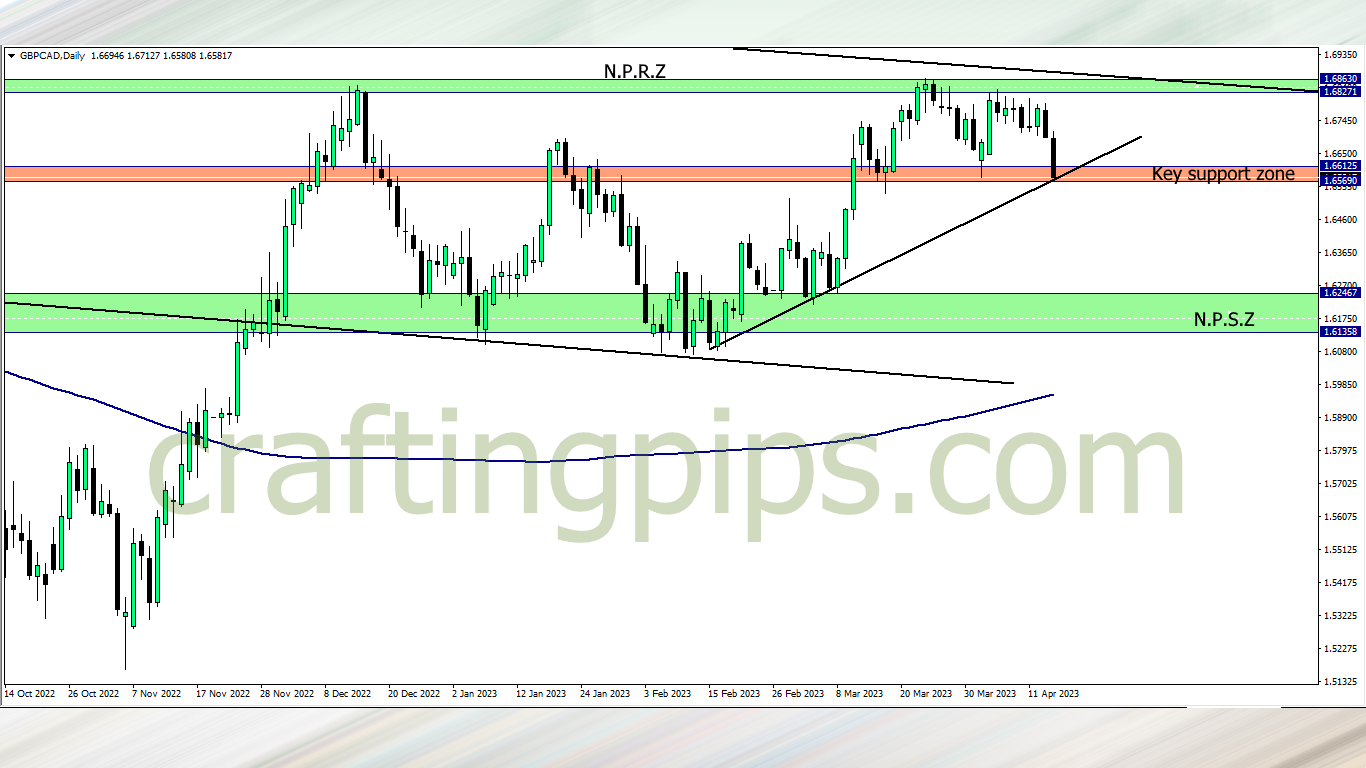
On the weekly time-frame of the GBP/CAD, there is a strong bearish engulfing candlestick at a key resistance zone which suggest that sellers were back in action a few hours before the close of the week.
This week, on the daily time frame we can see a triple bottom suggesting that last week’s sellers still have one more stronghold to break before we can comfortably say that its a sellers market this week.
A break below the key support zone will most likely support more sellers to drive price to NPSZ. If the support zone proves too difficult for the bears, then we may see a light or deep retracement. This could be further ascertained with the use of Fib levels.
2. GBP/CHF
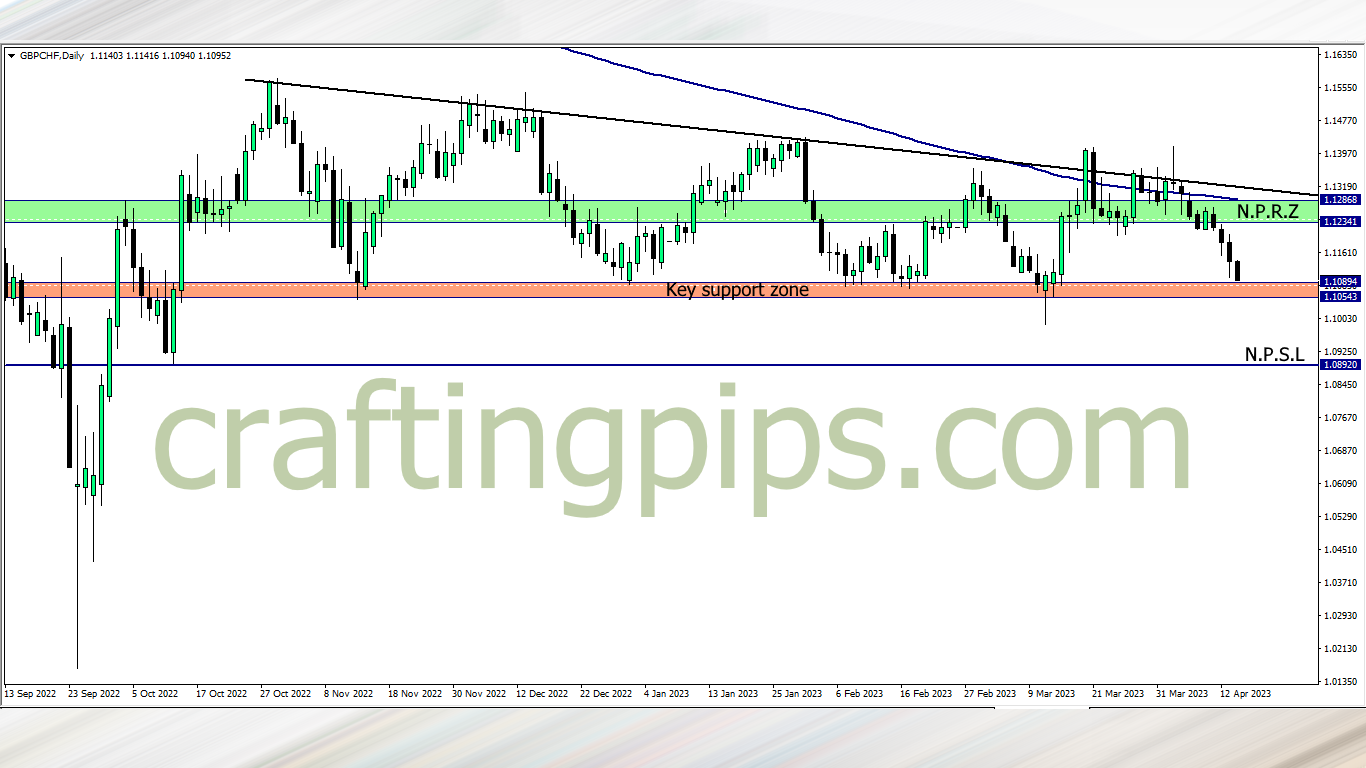
A 5 months old support zone is about to get tested this week on the GBP/CHF
A rejection may take price back to NPRZ, and a breakout will further encourage sellers to push price further down to NPSL
3. CAD/JPY
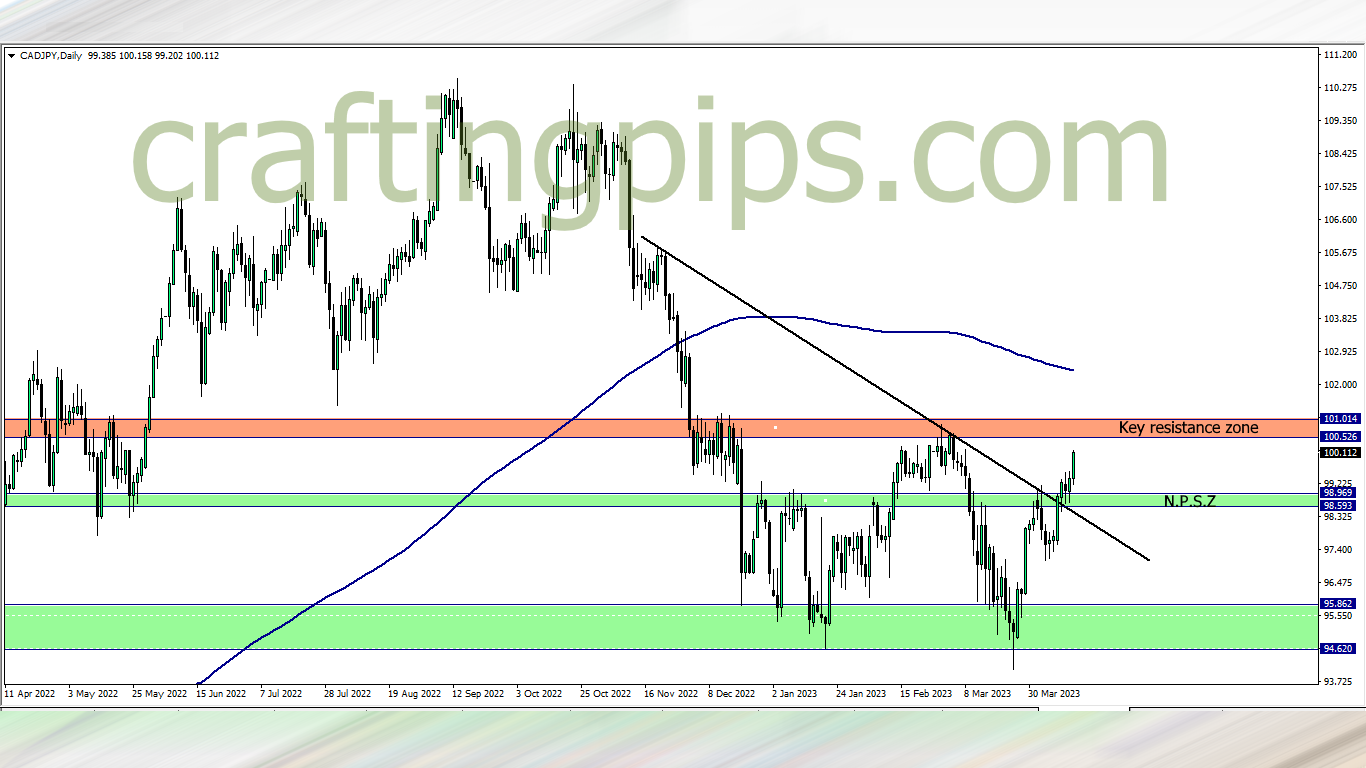
The CAD/JPY is close to a key resistance zone, and we may most likely see a pullback this week.
Again the pullback may be light or deep (Use your Fib levels to ascertain this).
What say you?
NOTE:
-
THE FUNDED TRADER: https://dashboard.thefundedtraderprogram.com/purchasechallenge-n/?sl=3322 (use the coupon code: THE0CRAFTER)
-
MY FUNDED FX: https://myfundedfx.tech/purchasechallenge/?sl=758