Hello traders,
let’s hit them charts:
1. GBP/USD
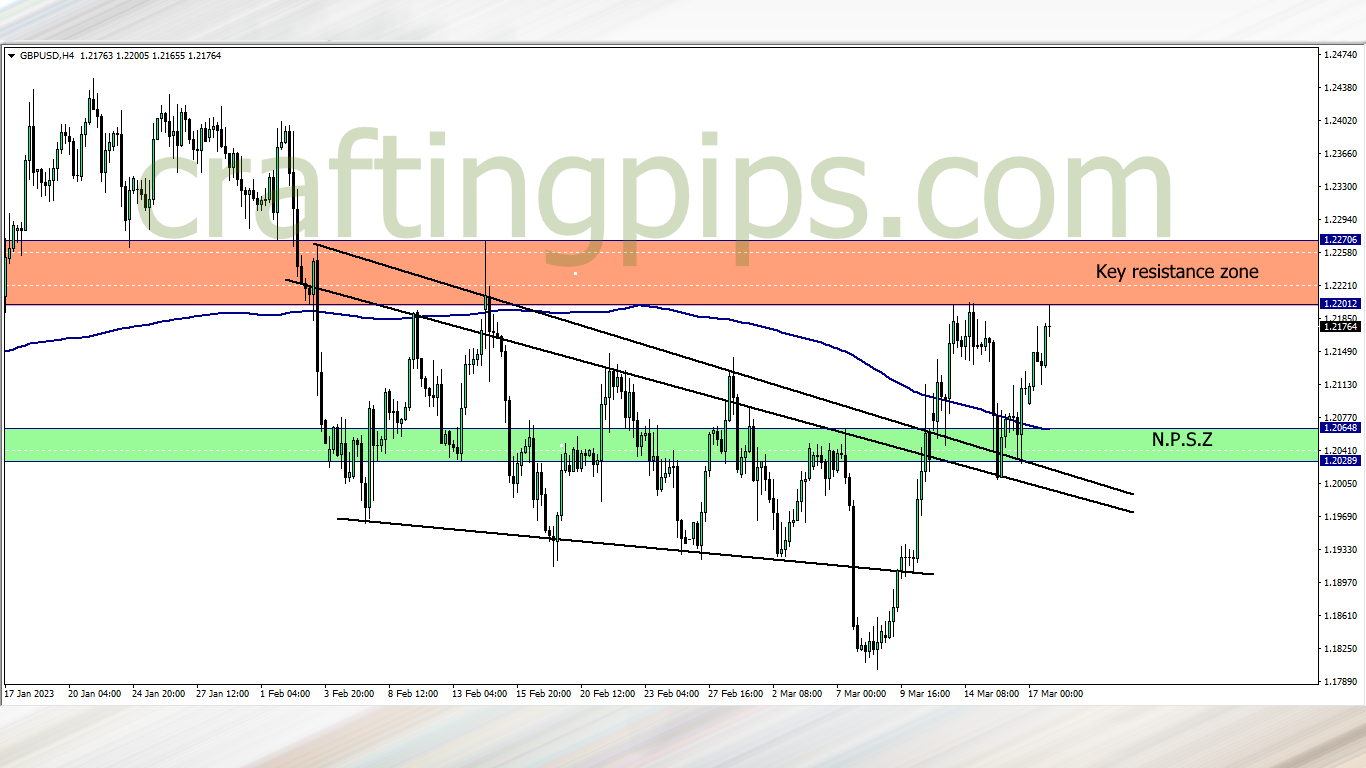
Double tops can be spotted on the GBP/USD.
Price closing with a doji shows that there is a possibility that price may return to NPSZ the first few days of the week, but there is a high level of risk selling this pair because the resistance zone does not give us a good risk/reward ratio.
2. GBP/CHF
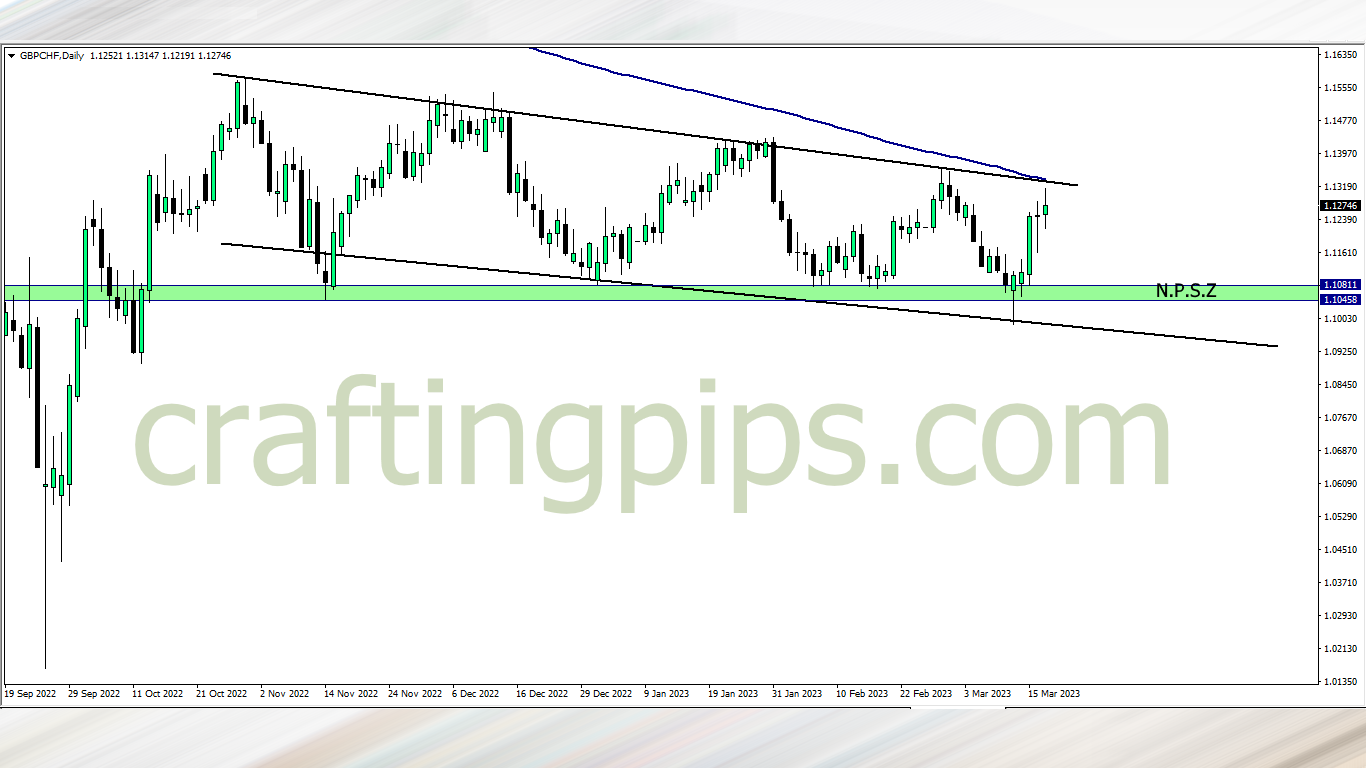
On the daily time frame price has reached a key resistance level, and the 200 ma also authenticates it.
This week we may most likely see price return to NPSZ.
3. EUR/CAD
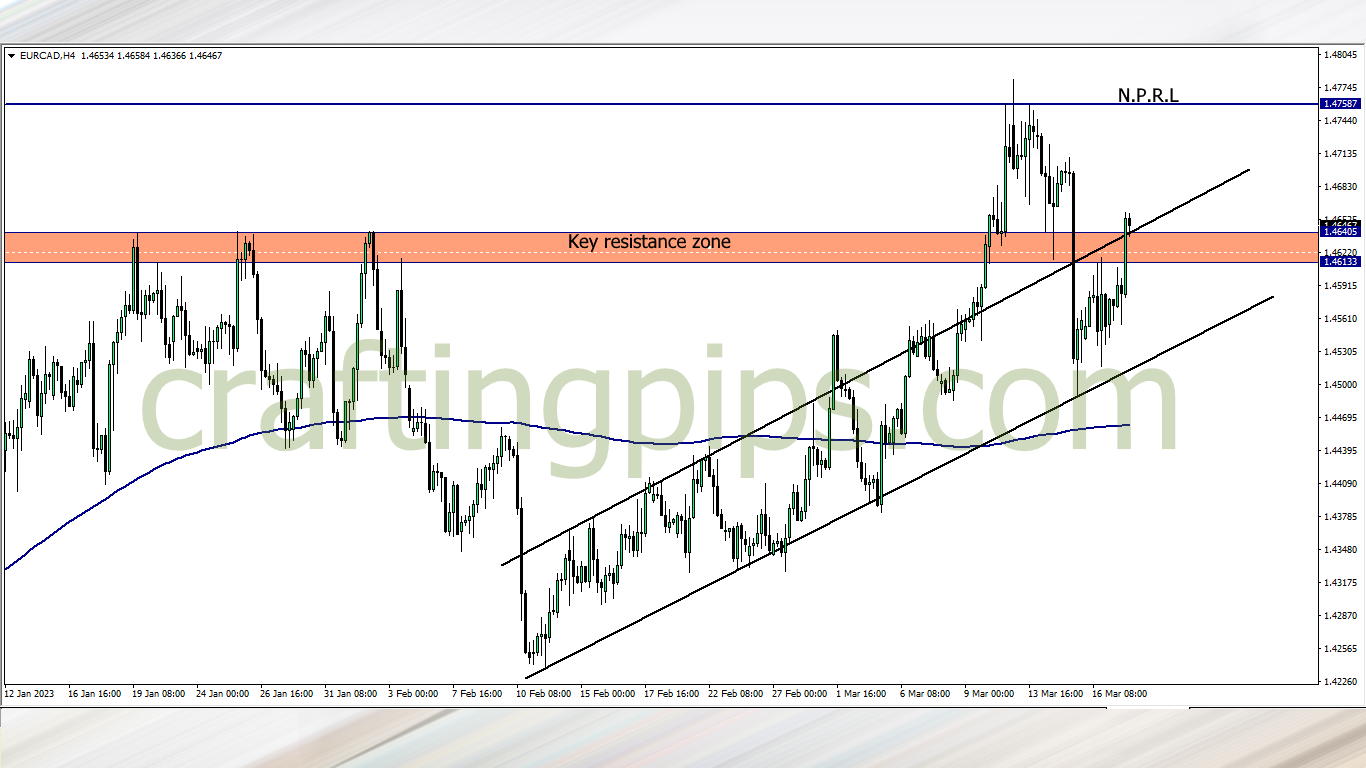
Since December 2021 the key resistance zone has managed to hold price.
Last week we saw a breakout of the key resistance zone. This week all we need is a bullish confirmation, and this may happen after a pullback. If that happens, then price next bus stop will most likely be NPRL
4. NZD/USD
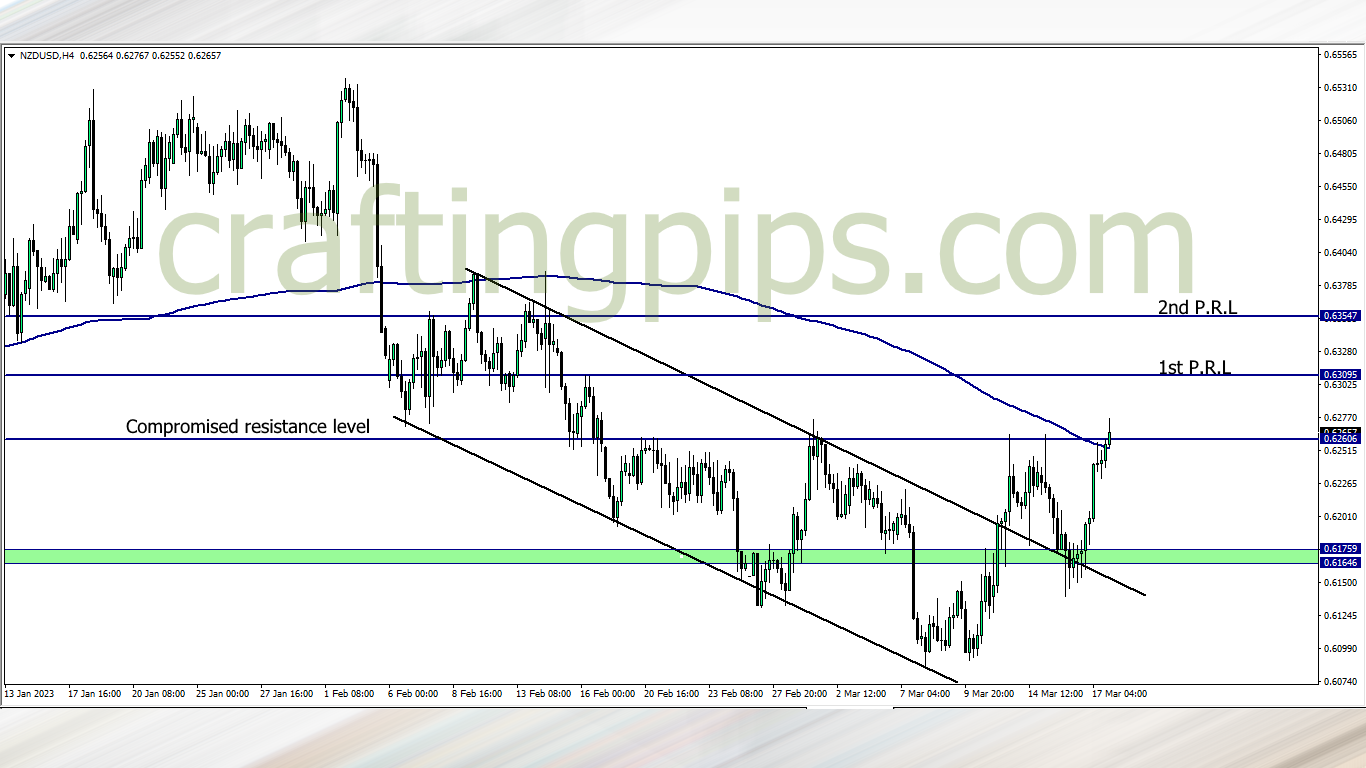
A partial breakout can be spotted on the NZD/USD.
This week all we need is a confirmation, then we ride with the bulls to the 1st PSL
What say you?
Our telegram group: https://t.me/+UujC4KoBe1AN0fnK
-
FIDELCREST: https://fidelcrest.com/#CRAFTER
-
THE FUNDED TRADER: https://dashboard.thefundedtraderprogram.com/purchasechallenge-n/?sl=3322 (use the coupon code: THE0CRAFTER)
-
MY FUNDED FX: https://myfundedfx.com/#a_aid=THE_CRAFTER