Hello traders,
I want to officially welcome you into the month of July. The second half of the year has officially commenced.
The market has some promising setups this week, let’s see how we can maximize them.
1. EUR/USD
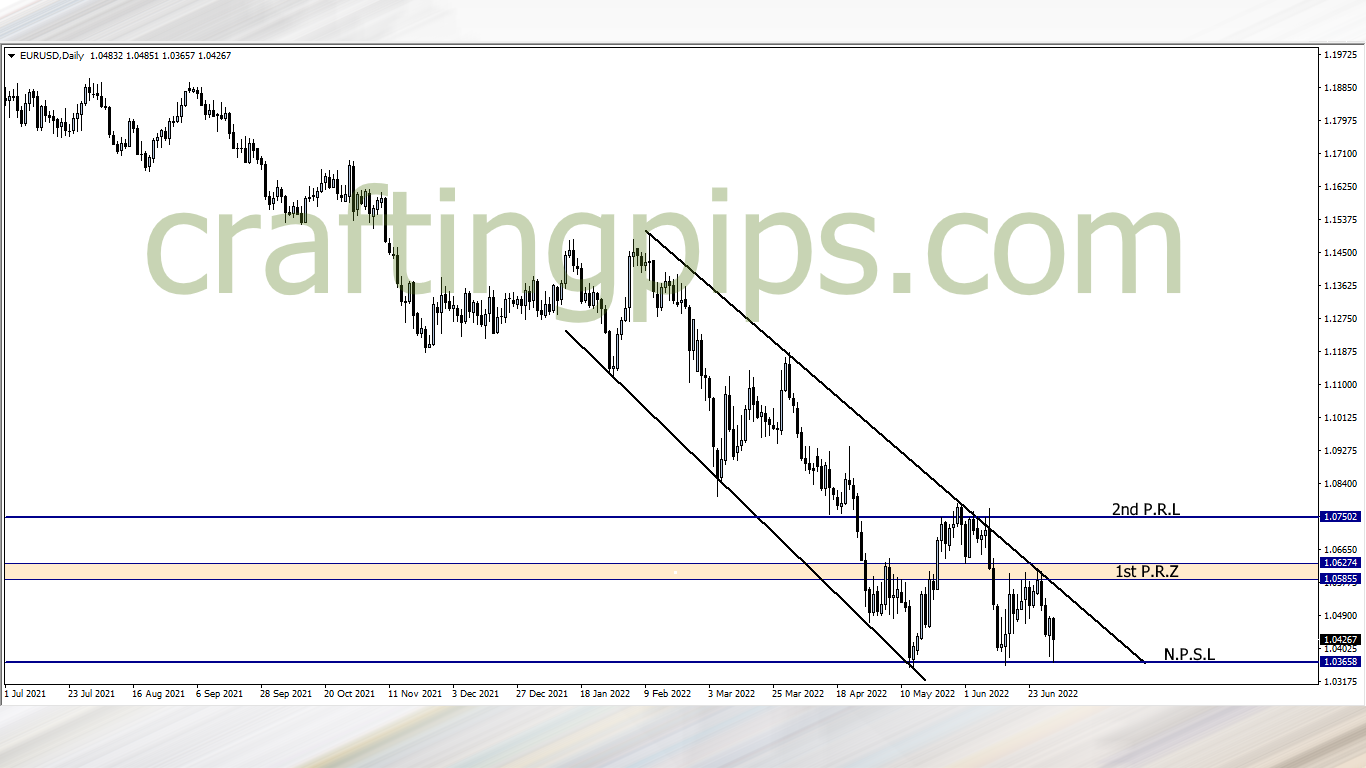
EUR/USD is locked in a ranging channel.
If you check the monthly time frame, you will observe that price is currently resting on a key support level (1.03658) which was last visited by price December 2016.
This week there is a huge probability that price may revisit a previous resistance zone which I have labelled 1st possible resistance zone
We should also watch out as the present support level is becoming weaker. The sellers have forced price to hit support level 1.03658 three times in the past two months plus, which is more than the December 2016 attempts to break this support level.
If the support breakout happens, then we may see price fall over 600 pips to the next possible support level (0.96790)
2. USD/CAD
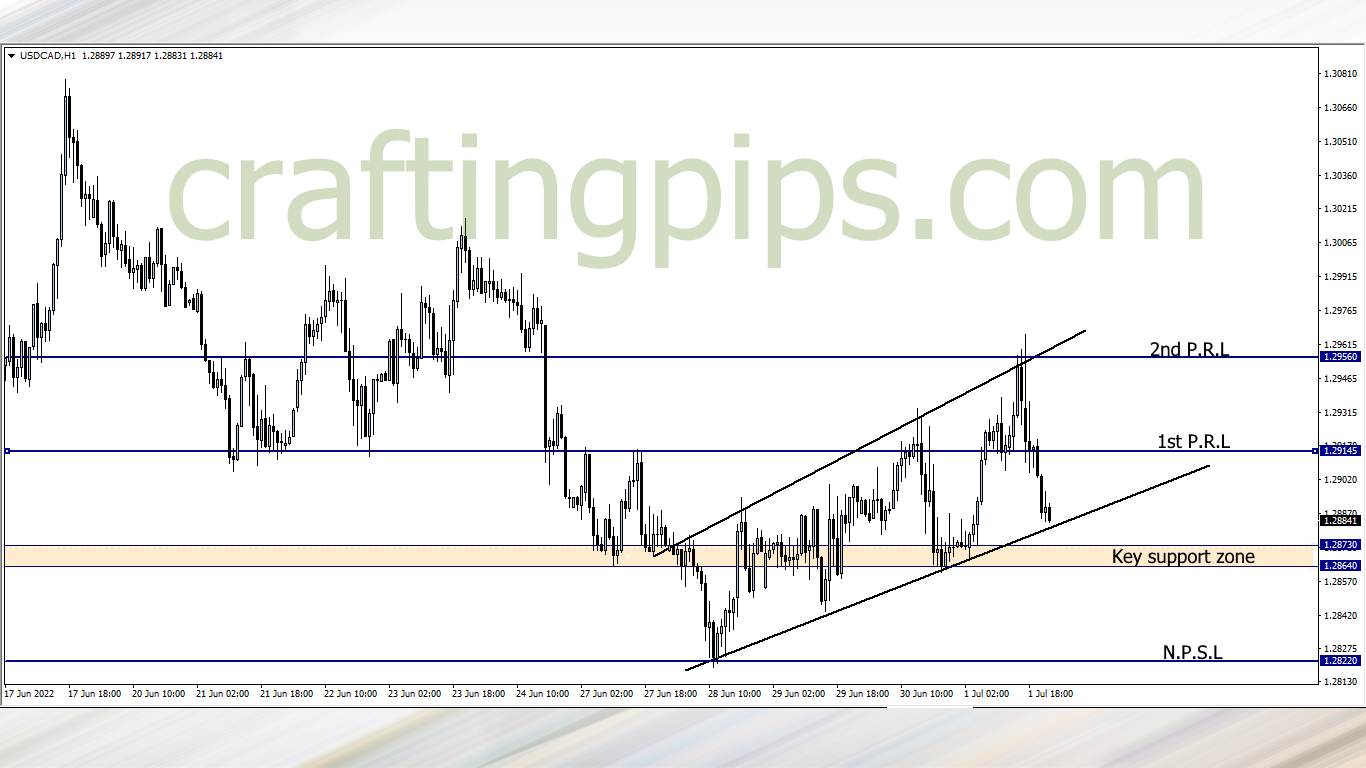
An ascending expanding channel can be seen on the USD/CAD.
This week, how price reacts around the key support zone will determine our next line of action. Last week closed with price visiting the key support zone for the fourth time.
A breakout means price may drop to support level 1.28220, and a reversal may encourage the bulls to take price back to resistance level 1.29145 and 1.29560
3. GBP/JPY
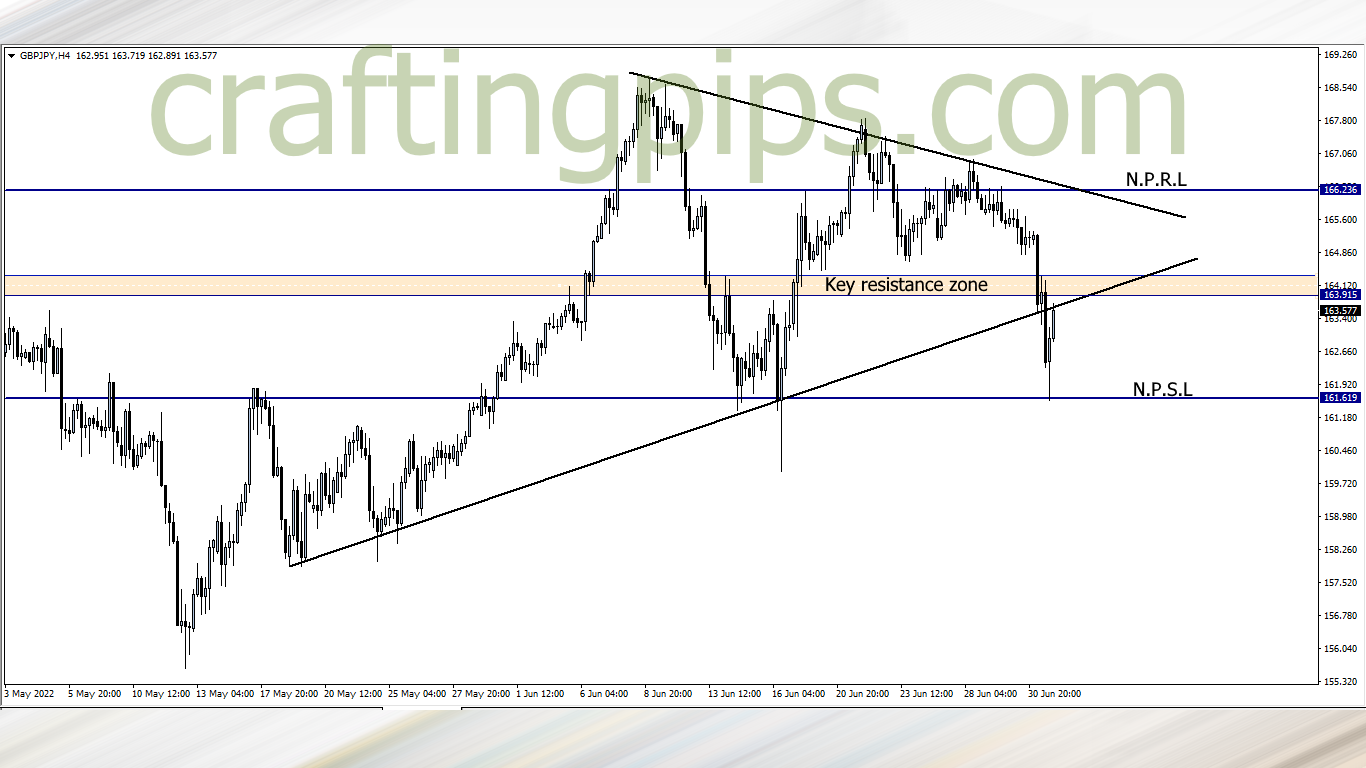
The bears ran out of the market on Friday after taking price down to a key support level (161.619)
The key resistance zone may prove a difficult task for the buyers to break, because history shows us that buyers have a tendency to lose the battle at this point, so we may see price revisit support level 161.619
That said, we know in speculations we deal with probabilities. So if price does not reverse at the present key support zone and instead, we see a breakout, then we will join the buyers to ride price to the next possible resistance level (166.236)
4. NZD/USD
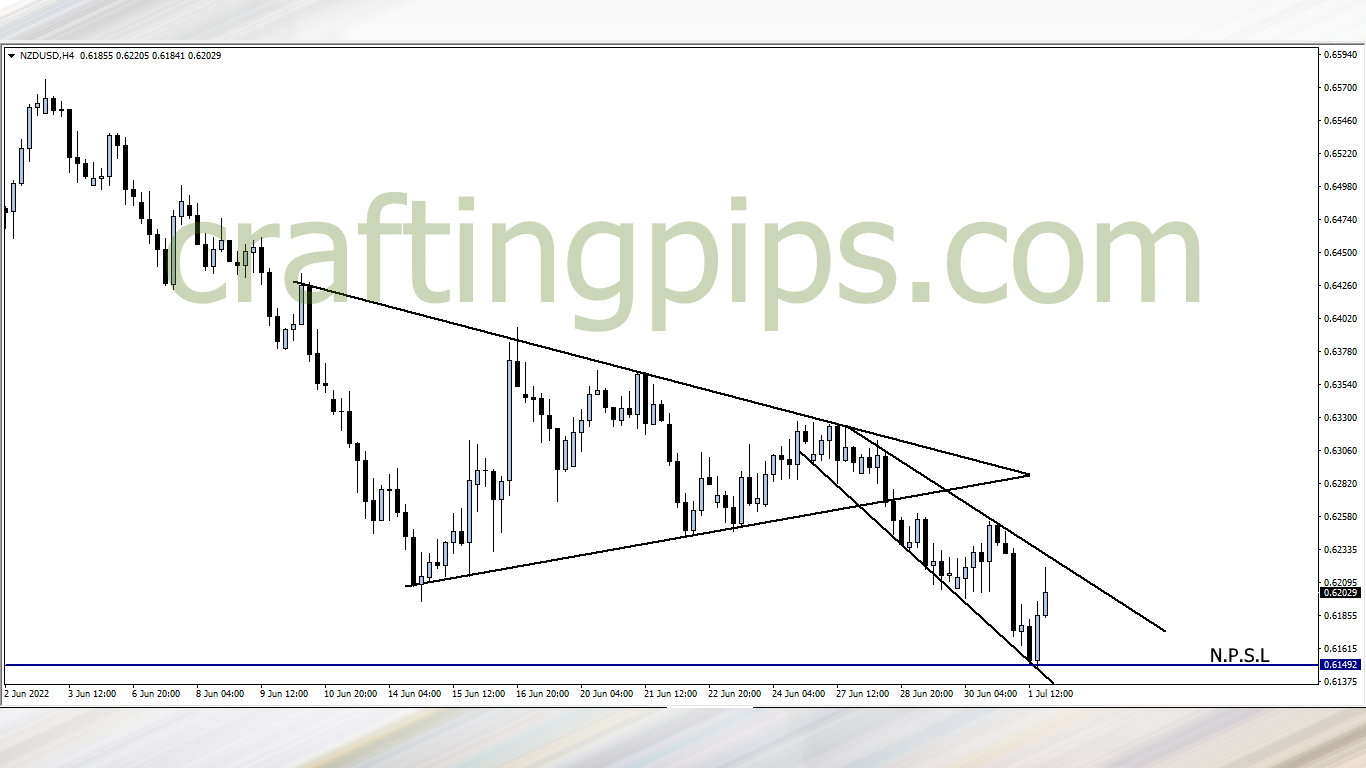
After price broke through a key support level of a triangle, price formed an expanding descending channel.
This week we may most likely see price revisit support level 0.61492 as it has reached the roof of the expanding channel, and a reversal is most likely to occur
5. NZD/JPY
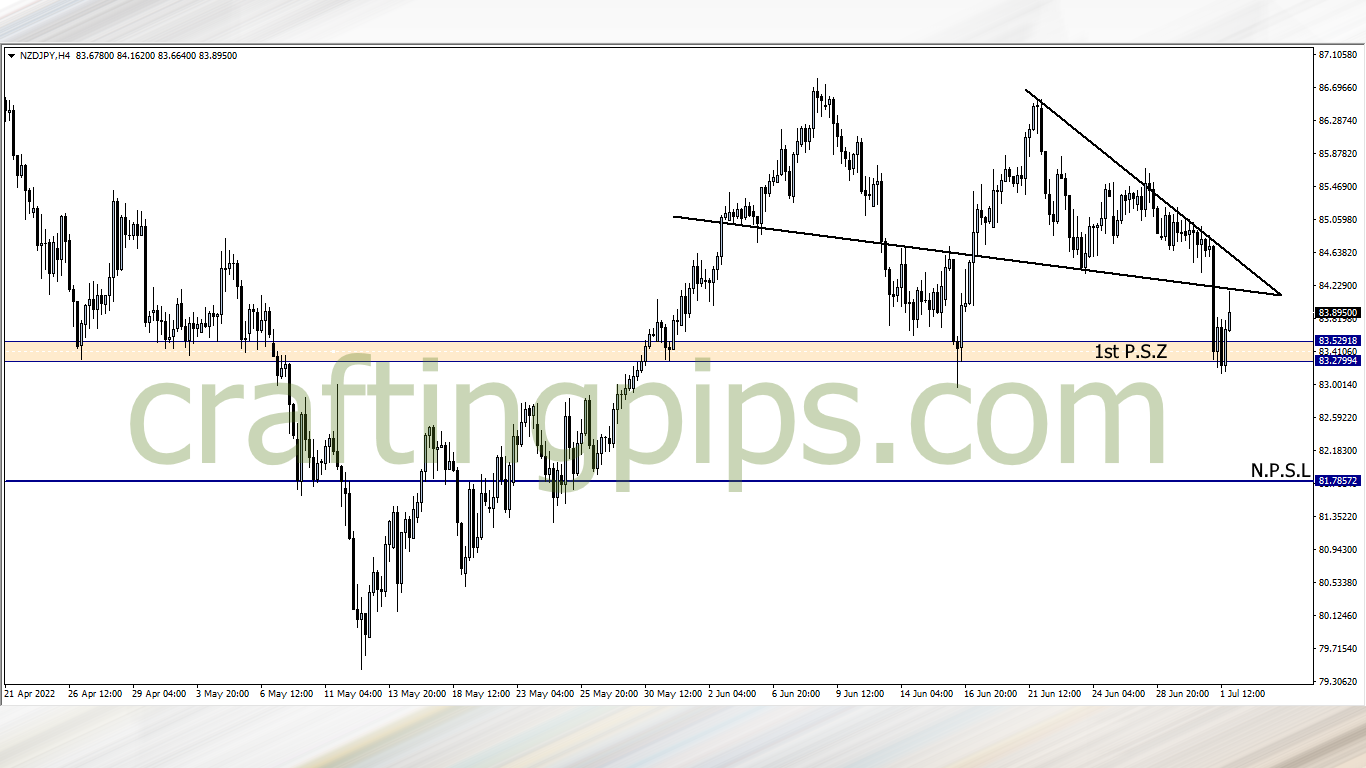
Last week we saw price break below the support level of a triangle for the second time. We also saw price bounce off a key support zone (83.52918-83.27994) for the second time.
Since history is bound to repeat itself (most times), there is a probability that price will be rejected by the current resistance level (84.16969). Meaning support zone 83.52918-83.27994 will most likely be revisited by price for the third time.
What say you?
Traders who are interested in joining our FREE trading group on Telegram, where trade ideas and trade-related topics are discussed, which could assist your trading career while being infected by positive vibes
hit us on Pip Crafters